The Oil and Gas Industry
Oil, often called “black gold,” is the backbone of the global energy system. Since the 19th century, it has driven industrialization and shaped global geopolitics. Investing in oil requires understanding a complex market that spans from crude extraction to the sale of fuels at a gas station. In this progressive guide (from basic to advanced level), we will learn all the fundamental concepts needed to invest in oil and oil companies, with a global and educational approach.
1. Introduction to the Oil Market
1.1 History and Evolution of Oil as a Commodity:
The use of oil dates back to antiquity (it was known as "rock oil" in Babylon), but its modern exploitation began in 1859 with the first commercial oil well drilled by Edwin Drake in Pennsylvania. In the early 20th century, oil replaced coal as the primary energy source, fueling the automotive industry (e.g., Ford's Model T in 1908) and economic expansion. Throughout the 20th century, crude oil prices remained relatively stable until the major oil crises of the 1970s, when OPEC embargoes caused prices to quadruple and revealed oil’s enormous geopolitical influence. Since then, the market has experienced boom-and-bust cycles: all-time highs in 2008 (Brent ~$147/barrel) followed by crashes, a historic plunge into negative territory in 2020 during the pandemic (WTI -$37/barrel), and subsequent recoveries. Today, oil remains the world’s primary fuel, although it faces competition from alternative energies.
1.2 Types of Crude Oil and Their Characteristics:
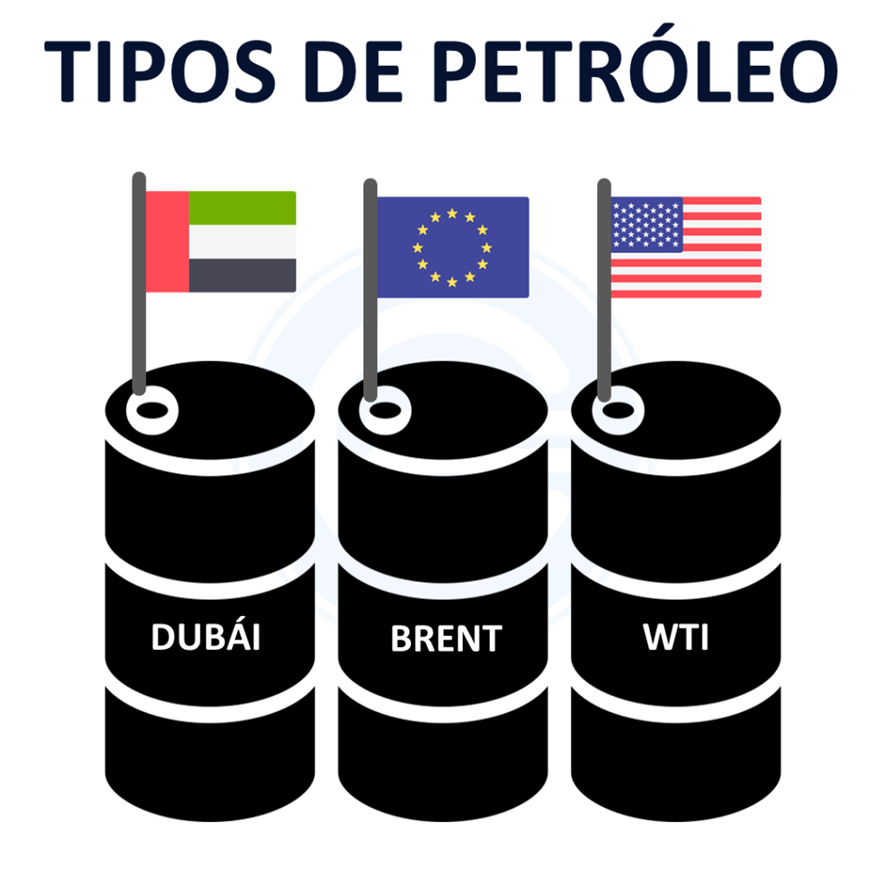
Not all crude oil is the same; it is classified by its density (light vs. heavy) and sulfur content (sweet vs. sour). Markets use benchmark crude types to set international prices:
-
Brent: Sourced from the North Sea (Europe), Brent is light and sweet (low density and low sulfur). It serves as the benchmark for European and global pricing, typically trading at a slight discount compared to WTI. Brent sets the price basis for over two-thirds of the world's crude oil.
-
WTI (West Texas Intermediate): A crude oil from Texas (USA), WTI is very light and sweet, even of higher quality than Brent. It is the benchmark in North America and is ideal for refining into gasoline. It usually trades close to Brent (historically sometimes a bit higher due to its quality).
-
Dubai/Oman: These Middle Eastern crudes are medium-grade and sour (higher sulfur content). They are used as benchmarks for pricing in Asia. Due to their relatively lower quality, they usually trade at a discount compared to Brent and WTI.
Additionally, there are many other regional blends (such as Urals from Russia, Maya from Mexico, etc.). In general, light and sweet crude oils are more valued because they yield more high-quality gasoline and diesel with less processing, whereas heavy or sour crudes generate more residuals (like fuel oil and asphalt) and require more complex refining. This is reflected in pricing: light/sweet crudes sell at a premium, while heavy/sour crudes trade at a discount.
1.3 Main Petroleum Derivatives:
Crude oil is processed through refining to obtain multiple derivatives, which are the backbone of modern industry. The main petroleum products include:
-
Gasoline (naphtha): Fuel for cars and light vehicles. It’s a light derivative in high demand for road transport and light aviation.
-
Diesel (gas oil): Fuel for diesel engines in trucks, buses, heavy machinery, and also heating. It has a higher energy density than gasoline.
-
Kerosene/Jet Fuel: Fuel for aircraft turbines and special stoves. It’s an intermediate fraction between gasoline and diesel.
-
Fuel oil: A heavy residue used as fuel in ships, power generation, and industrial boilers. There are both light and heavy grades depending on their density.
-
Lubricants and oils: Heavier derivatives refined to reduce friction in engines and machinery.
-
Asphalt and bitumen: Very heavy products used in paving and roofing.
-
Petrochemical feedstocks (ethane, propane, naphtha): Used to produce plastics, fertilizers, detergents, synthetic rubbers, etc. In other words, oil not only powers vehicles but is also indirectly present in countless everyday products.
Oil also yields petrochemical raw materials (ethane, propane, naphtha) that are essential in manufacturing plastics, fertilizers, detergents, synthetic rubbers, and more. So, oil doesn't just fuel transportation; it is embedded in numerous modern products.
2. Oil Reservoirs
In the oil market, reservoirs are underground geological formations where hydrocarbons (mainly oil and natural gas) accumulate. These reservoirs are classified based on various criteria: geological formation, location, depth, and the type of crude they contain. Below are the main types:
2.1 By Geographic Environment:
🔹 Onshore reservoirs
-
- Located on land.
- Easier and cheaper to develop than offshore fields.
- Examples: Permian Basin (USA), Orinoco Belt (Venezuela)
🔹 Offshore reservoirs
-
- Located beneath the seabed.
- Require offshore drilling platforms.
- They are divided into:
-
Shallow water offshore: less than 200 meters deep.
-
Deepwater offshore: between 200 and 1,500 meters.
-
Ultra-deepwater: more than 1,500 meters.
-
-
Examples: Pre-salt fields in Brazil, Gulf of Mexico.
2.2 By Geological Trap Type:
🔹 Structural traps
-
- Formed by deformations in rock layers (anticlines, faults, salt domes).
- The most common and productive.
🔹 Stratigraphic traps
-
- Result from changes in rock porosity or permeability.
- Harder to detect using seismic methods.
🔹 Combination traps
-
- Include features of both structural and stratigraphic types.
2.3 By Type of Crude Oil Contained:
🔹 Conventional oil
-
- Flows easily.
- Extracted using traditional techniques.
- High profitability.
🔹 Unconventional oil
-
- Heavier, more viscous, or trapped in challenging formations.
- Requires advanced extraction techniques:
-
Oil sands (bituminous sands): Very heavy oil embedded in sand, processed into synthetic crude (e.g., Alberta, Canada).
-
Shale oil: Oil in low-porosity rock (e.g., Bakken, Permian), extracted via fracking.
-
Heavy / extra heavy oil: e.g., Orinoco Belt.
-
Tight oil: From low-permeability rocks.
-
Pre-salt deepwater: Fields beneath thick salt layers in deep waters, making extraction difficult.
-
Shale gas: Gas trapped in low-porosity rocks, extracted via hydraulic fracturing (fracking).
-
Shale oil: Also trapped in shale formations, extracted using fracking.
-
- Heavier, more viscous, or trapped in challenging formations.
2.4 By Physical State of the Hydrocarbon:
🔹 Oil reservoirs
-
- Contain mainly liquid crude, sometimes with dissolved gas.
🔹 Gas reservoirs
-
- Contain mainly natural gas, with or without liquid condensates.
🔹 Condensate gas reservoirs
-
- The gas contains hydrocarbons that condense at the surface.
3. Extraction Methods
Depending on the type of reservoir, geological location, and crude oil characteristics.
3.1 Primary Extraction (Natural Method)
Description: Relies on the reservoir’s natural pressure (from gas, water, or rock) to push the oil to the surface.
Techniques:
-
Simple vertical well
-
Directional/horizontal well (in more complex cases)
Recovery: Extracts between 5% and 15% of the oil in the reservoir.
Cost: Low — it is the most economical method.
Application: Used in conventional reservoirs and during the early years of a well's life.
3.2 Secondary Extraction (Fluid Injection)
Description: Water or gas is injected to maintain or increase reservoir pressure.
Techniques:
-
Water injection
-
Injection of natural gas, nitrogen, or CO₂
Recovery: Boosts total recovery to 30–50%.
Application: When natural pressure drops.
3.3 Tertiary or Enhanced Oil Recovery (EOR)
Description: Advanced methods used to mobilize the remaining oil that cannot be recovered through primary or secondary methods.
Techniques:
-
Polymer injection: increases water viscosity.
-
Steam flooding: especially effective for heavy oils.
-
High-pressure CO₂ injection: dissolves oil to improve its flow.
-
Chemical and thermal methods.
Recovery: Raises total recovery to 60% or more.
Cost: High — but profitable when oil prices are high.
Application: In heavy oils, mature fields, or unconventional reservoirs.
3.4 Hydraulic Fracturing (Fracking)
Description: High-pressure injection of water, sand, and chemicals to fracture rock and release trapped oil/gas.
Application: For shale oil and gas.
Reservoir Type: Unconventional.
Leading Countries: USA, Argentina.
🔧 How Fracking Works:
-
-
-
Vertical and then horizontal drilling:
A vertical well is drilled to reach the shale formation, then extended horizontally for several kilometers within the hydrocarbon-bearing rock layer. -
High-pressure fluid injection:
A mixture of water (90%), sand (9%), and chemicals (1%) is injected at extremely high pressure. -
Fracture creation:
This creates microscopic fractures in the rock. -
Oil/gas release:
The fractures allow trapped oil/gas to flow into the well.
The sand keeps the fractures open, enabling continuous hydrocarbon flow.
-
-
3.5 Oil Sands Mining
Description: Extraction of oil from sands rich in bitumen.
Methods:
-
Open-pit mining: used when deposits are close to the surface.
-
Steam-Assisted Gravity Drainage (SAGD): used for deeper sands.
Application: Extra-heavy oil.
Example: Alberta, Canada.
3.6 Offshore (Marine) Production
Description: Extraction from seabed reservoirs using platforms.
Types:
-
Shallow water (< 200 m)
-
Deepwater (up to 1,500 m)
-
Ultra-deepwater (> 1,500 m)
Cost: Very high, but also highly productive.
Examples: Gulf of Mexico, North Sea, Pre-salt Brazil.
📌 Quick Summary Table:
| Method | Reservoir Type | Estimated Recovery | Cost | Technology |
|---|---|---|---|---|
| Primary | Conventional | 5–15% | Low | Basic |
| Secondary | Conventional | 30–50% | Moderate | Injection |
| Tertiary (EOR) | Mature / Heavy | 50–60%+ | High | Advanced |
| Fracking | Unconventional (shale) | Variable | High | Highly advanced |
| Oil Sands | Extra heavy | 10–20% | Very high | Mining / Steam |
| Offshore | Marine | Similar to onshore | Very high | Specialized |
4. Industry Segments
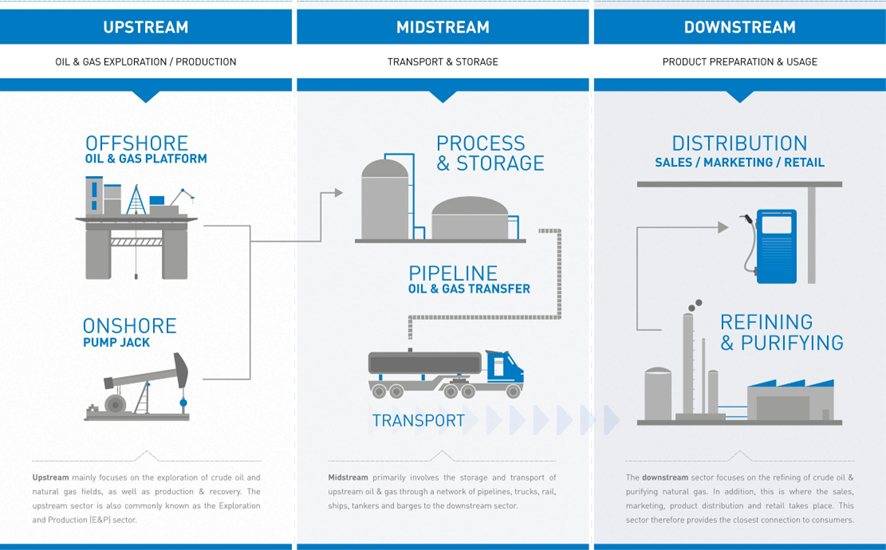
4.1 Upstream (Exploration and Production)
Upstream refers to the exploration and production of hydrocarbons. It is the initial phase involving the search for oil and gas reservoirs (via seismic and geological exploration), drilling of wells, and extraction of crude oil or natural gas. Upstream companies are often referred to as E&P (Exploration & Production) firms. They are the most directly impacted by crude oil prices, as their revenue depends on selling what they produce.
Examples: Occidental Petroleum (an independent E&P company) and state-owned firms like Pemex Exploración y Producción.
Upstream activity is high-risk (due to geological uncertainty and sunk capital investments) but offers potentially high rewards if commercially viable reserves are found. It also includes operations in deepwater, shale, etc.
4.2 Midstream (Transportation and Storage)
Midstream represents the intermediate link that connects production with consumption. It includes the transportation of crude oil and gas (via pipelines, oil tankers, gas pipelines, and tanker trucks), storage in tanks, and sometimes initial processing (e.g., gas plants to liquefy or separate liquids).
Midstream companies typically use fee-based business models — they charge tolls for moving or storing barrels, generating relatively stable, contractual revenues.
Examples: Kinder Morgan, Enbridge, port terminal operators, etc.
These firms are less sensitive to crude oil prices and more dependent on transport volumes (although volumes can fall when production declines due to low prices).
Many U.S. midstream firms are structured as MLPs (Master Limited Partnerships) — a common corporate structure in U.S. energy sectors, known for high dividend payouts (distributions) to investors. MLPs are exempt from corporate income tax if 90% of their income comes from qualified energy activities.
4.3 Downstream (Refining and Distribution)
Downstream involves refining crude oil into finished products and the distribution and marketing of fuels. In refining, crude oil is processed in refineries to produce gasoline, diesel, kerosene, lubricants, petrochemicals, and more. Distribution includes storing refined products, transportation (via pipelines or tanker trucks), and retail sale at gas stations or bulk sales to industrial customers.
Downstream companies typically operate refineries and retail or wholesale networks.
Examples:
-
Valero (large independent refiner)
-
Phillips 66 (refining and marketing operations)
-
In Latin America: Ecopetrol, Repsol (refining and fuel sales assets)
Downstream profits depend on refining margins, which are the difference between crude oil prices and product prices (e.g., margin from turning crude into gasoline/diesel). Ironically, refiners may benefit from low crude prices (lower raw material costs) and suffer when oil prices rise — the opposite of upstream.
Retail gas stations tend to have stable margins, as they often pass costs directly to the end consumer.
4.4 Oilfield Services
This segment includes companies that do not produce oil or gas directly, but provide essential technical, operational, and logistical services that enable upstream (exploration & production) companies to operate. These are considered the "operational arm" of the oil industry.
4.4.1 Main Services Provided:
-
Drilling rig rental and operation: Onshore and offshore platforms (including high-tech), maintenance, installation, and removal.
-
Seismic and geophysical services: Subsurface studies and 2D/3D/4D seismic analysis to identify hydrocarbon-bearing structures.
-
Well engineering and design: Geological modeling, drilling planning, and reservoir simulation.
-
Hydraulic fracturing and well completion: Key techniques for maximizing oil/gas recovery, especially in unconventional (shale) reservoirs.
-
Cementing, casing, and well stimulation services
-
Specialized logistics and transport: Moving heavy equipment, hazardous materials, crude oil, or intermediate products.
-
Subsea services: Installation and maintenance of pipelines and equipment in offshore fields (e.g., deepwater operations).
4.4.2 Types of Service Companies:
-
Large global integrators: e.g., Schlumberger, Halliburton, Baker Hughes, Weatherford — provide full-scale services worldwide.
-
Mid-size and niche firms: Focused on specific areas like seismic, cementing, or subsea services.
-
National companies: In some countries, local or state-owned service providers operate alongside multinationals.
4.4.3 Business Characteristics:
-
Highly dependent on the oil cycle: Oilfield service activity volume directly tracks E&P spending. In high oil price periods, demand soars; during downturns, it’s the first segment to suffer cuts.
-
Technology- and capital-intensive: Services often require sophisticated equipment, advanced software, and highly specialized labor.
-
Contract-based relationships: Contracts are usually medium-term, with fixed or performance-based pricing.
📉 Example of vulnerability:
During oil price crises (like 2014–2016 or 2020), many oilfield service companies went bankrupt or had to restructure due to a sharp decline in drilling investments.
5. Types of Companies
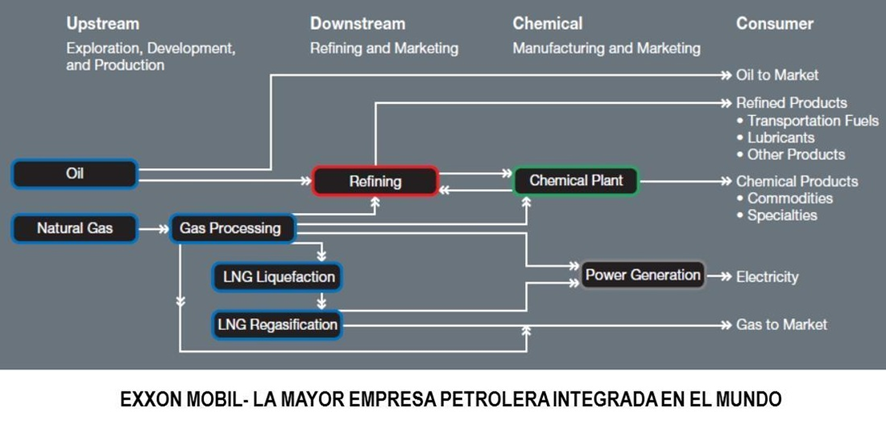
5.1. Integrated Companies
Integrated oil companies operate across the entire value chain—upstream, midstream, and downstream: they produce their own oil and gas, transport it, refine it, and sell it as fuel or petrochemical products. This allows them to leverage synergies and balance risks.
For example, if crude prices fall, their upstream segment earns less, but their downstream segment might earn more due to lower feedstock costs. The best-known integrated companies are the so-called “Supermajors” or Majors: ExxonMobil, Chevron, Shell, BP, TotalEnergies, Eni, and Equinor, among others. Saudi Aramco is also integrated (it produces and refines on a large scale). These companies are usually huge multinationals, present in dozens of countries with geographical and operational diversification.
5.2. Specialized Companies
On the other hand, there are many specialized companies that focus on just one segment. For example, pure explorers and producers (known as independents): CNOOC in China focuses only on upstream, or Continental Resources (shale oil in the U.S.). Others are dedicated solely to refining and marketing, such as the aforementioned Valero or Reliance Industries in India (a major refiner).
There are also midstream-only transport companies, such as Transneft in Russian pipelines. Specialized companies have more volatile results depending on the price in their segment (a pure E&P company will rise/fall significantly with crude prices, while a pure refiner will do the opposite). In contrast, integrated companies tend to have more stable aggregate cash flows, although their stock market valuation still heavily depends on crude and gas prices. Strategically, many integrated companies are also investing in renewables and new areas (such as hydrogen or carbon capture) to diversify their future in the face of the energy transition.
5.3. “Majors” and “Juniors”
This nomenclature is mainly used in the exploration and production field. The “Oil Majors” usually refer to the large private companies mentioned (Exxon, Shell, etc.), characterized by massive market capitalization, global presence, and production of millions of barrels of oil equivalent per day. They have privileged access to gigantic projects, advanced technology, and low-cost financing.
In contrast, “junior oil companies” are small or medium-sized oil firms, often focused on exploration in emerging areas or marginal production. They can be exploratory startups that hold rights over a block and seek to discover oil. Their production (if any) is small in comparison (a few thousand barrels per day). These juniors offer investors high growth potential (if they discover a large field, their shares skyrocket or they are acquired by a major), but also high risk (they might find nothing and exhaust their capital). A successful junior example was Tullow Oil in Africa, which moved from junior to mid-size producer after discoveries in Ghana. In Canada, there are many juniors focused on shale or oil sands. The term “junior” is more informal but useful to distinguish size and impact: majors move the global market, while juniors operate in niches and often rely on capital market funding to survive.
5.4. State-Owned and Private Companies
Another key classification is by ownership structure. Many of the world’s largest reserves and production are controlled by state-owned National Oil Companies (NOCs), owned fully or mostly by governments. Prominent examples: Saudi Aramco (Saudi Arabia), Gazprom and Rosneft (Russia), CNPC/PetroChina (China), Pemex (Mexico), Petrobras (Brazil, although partially private). These companies often have mandates beyond profit (e.g., ensuring domestic supply, maximizing oil revenue for the state, employing local workers), and their investments/production may align with political goals.
In international capital markets, however, private or publicly traded companies (IOCs, International Oil Companies) like the aforementioned Western firms stand out. State-owned companies sometimes list a portion of their shares on stock exchanges (e.g., Petrobras has publicly traded shares, although the state controls >50%). Investing in a state-owned oil company involves considering country and political interference risks: for example, Petrobras has faced fuel price controls in Brazil that affected its margins.
6. Supply and Demand Fundamentals
6.1. Producing and Consuming Countries
The oil market is truly global. In terms of production, around 100 million barrels per day (mbd) are extracted worldwide. The largest current producers include the United States (~11 mbd in 2021), thanks to the shale oil boom, Russia (~10 mbd), and Saudi Arabia (~9–10 mbd). They are followed by countries such as Canada, Iraq, China, Iran, and Brazil, each producing between ~3 and 5 mbd. On the consumption side, the United States (~19 mbd in 2019) and China (~14 mbd) stand out, together accounting for about 33% of global demand. Other major consumers include India (~5 mbd), Japan (~3.8 mbd), and Europe as a whole. Demand growth in recent decades has mainly come from emerging Asian economies (China and India are expected to represent ~70% of the consumption increase in 2024), while in developed countries, consumption tends to stagnate or grow only marginally.
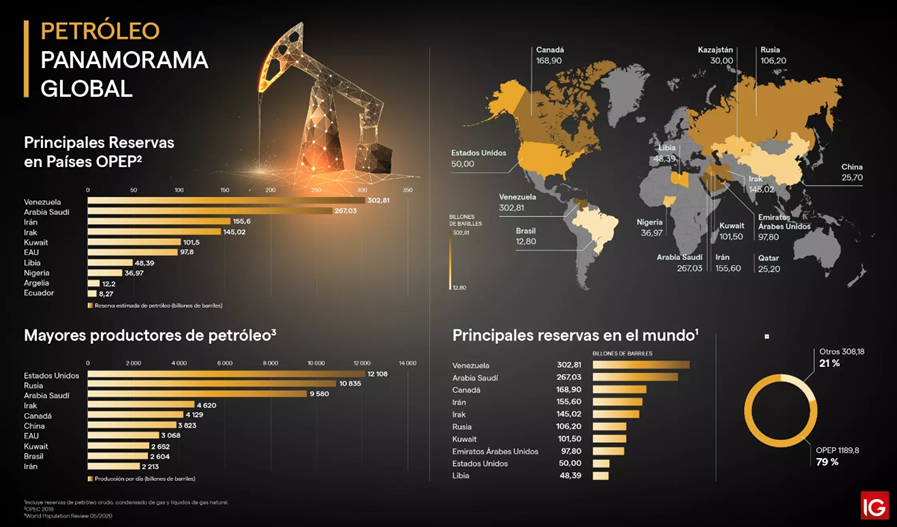
6.2. OPEC and Non-OPEC Countries
OPEC (Organization of the Petroleum Exporting Countries), founded in 1960, brings together nations with large reserves (Saudi Arabia, Iraq, Venezuela, the UAE, among others). Historically, OPEC has aimed to coordinate its members' production to influence prices. Currently, OPEC countries provide about ~27% of the world’s crude supply. If their allies are included (OPEC+, an alliance that incorporates non-OPEC producers like Russia, Kazakhstan, Mexico, etc.), the OPEC+ bloc covers about ~41% of global demand.
6.3 Supply-Demand Cycles
The oil market is cyclical. A small imbalance of 1–2% between supply and demand can cause large price swings, as both are relatively inelastic in the short term. During periods of strong economic growth (e.g., the 2003–2008 boom), oil demand can exceed supply (which takes years to adjust with new production), reducing inventories and driving up prices. In turn, high prices encourage investment in new projects and energy efficiency. With a lag, more supply arrives or demand falls, creating oversupply that crashes prices (as seen in the 2014–2016 decline driven by the U.S. shale boom). Oil companies and producing countries have learned the hard way about this volatility: after three major crashes in 15 years, many now seek projects that are profitable even with crude at $30 per barrel to survive potential downturns.
6.4 Proven Reserves by Country
A key concept is proven oil reserves (1P): the volume of crude that can be extracted with 90% certainty using current technology and in an economically viable way. Reserves indicate a country’s or company's long-term potential. For example, Venezuela holds the largest proven reserves in the world, estimated at over 300 billion barrels (thanks to its heavy crude deposits in the Orinoco Belt). Saudi Arabia has ~267 billion barrels, followed by countries such as Iran (~209 billion), Canada (~171 billion, mainly in oil sands), and Iraq (~145 billion). However, having huge reserves doesn't guarantee high production if there are geopolitical or technical limitations. Venezuela is illustrative: despite its vast resources, its output is under 1 mbd due to sanctions, lack of investment, and operational issues. In contrast, Saudi Arabia, with stability and investment, produces ~10 mbd and has capacity for 12–13 mbd in the near future.
6.5 Production Capacity
Production capacity is the maximum amount a country or company can pump in the short term. Some producers maintain spare capacity (especially Saudi Arabia and others in the Gulf) that acts as a buffer in times of crisis. For instance, if war or disaster reduces supply in one country, the Saudis can quickly ramp up production to prevent shortages. This spare capacity (currently a few million barrels per day globally) is closely watched by investors, since when global supply nears its limit, prices tend to include a risk premium for any unexpected disruption.
In summary, global supply depends on geological factors (reserves), technological (fracking, deep drilling), economic (extraction costs), and political (OPEC+ decisions, sanctions). Demand, meanwhile, is tied to economic growth, population, seasonality (more travel in summer increases consumption), and increasingly to energy efficiency and substitutes (electric cars, etc.). The balance between both sides determines the trend of the oil market.
7. Official Reports
7.1. EIA (U.S. Energy Information Administration)
The EIA publishes the Weekly Petroleum Status Report in the U.S. This report shows crude and product inventory levels in the U.S., national production, imports/exports, and implied demand. An unexpected inventory increase may indicate oversupply (bearish signal), while a sharp decline suggests stronger-than-expected demand (bullish signal). The EIA also issues monthly and annual reports, such as the Short Term Energy Outlook (STEO) with short-term production and demand forecasts, and the Annual Energy Outlook with long-term scenarios.
7.2. OPEC Monthly Report
OPEC publishes its Monthly Oil Market Report (MOMR), which thoroughly analyzes global oil market trends. It includes production data for its members, supply estimates for non-OPEC countries, global demand broken down by region, inventories, and a market forecast for the upcoming year. This report reveals OPEC’s perspective: for example, if a supply surplus is expected, it might suggest the need for production cuts. Investors use it to anticipate possible changes in OPEC quotas. The MOMR also reports the “call on OPEC” (the amount of OPEC crude needed to balance the market), which helps assess whether OPEC may need to increase or decrease output.
7.3. IEA Monthly Report
The International Energy Agency (IEA), a body representing consumer countries (OECD), publishes a widely-followed monthly Oil Market Report. Like OPEC's, it covers supply, demand, inventories, and prices, offering the consumer side’s view. It provides analysis of key developments and short-term global production and consumption forecasts. The IEA usually emphasizes demand and emergency reserves; its reports sometimes urge OPEC+ to fill supply gaps or warn about oversupply. Investors and traders compare IEA and OPEC projections to anticipate imbalances. The IEA also publishes the World Energy Outlook annually, a comprehensive report with long-term scenarios that assesses, among other things, the future of oil under various climate policies (useful for strategic investors evaluating multi-decade trends).
In summary, reading these reports helps investors form an informed view: to understand whether the market is heading for a surplus or deficit, how fast demand is growing, how much OPEC is producing relative to its quota, etc. For example, a downward revision in demand by the IEA or OPEC may lower prices by anticipating weaker consumption, while an EIA report showing stagnant production amid strong demand may push prices up. Staying up to date with this fundamental data helps separate real signals from daily speculative noise.
8. Evaluation of Oil Companies
Investing in oil companies requires an understanding of their financial statements and industry-specific metrics. Since these are capital-intensive businesses subject to commodity price fluctuations, their analysis involves unique characteristics. Below are the key indicators and aspects to evaluate regarding the financial health and valuation of oil companies:
8.1 Cash Flow and CAPEX:
Operating cash flow is crucial, as it shows the cash generated from oil and gas sales. During high-price periods, oil companies generate large cash flows, but in sharp downturns (like in 2020), they may even report negative operating flows. Investors closely monitor CAPEX (capital expenditures), which includes investments in exploration, field development, refinery maintenance, etc. The oil industry typically requires high CAPEX to replenish reserves and maintain capacity (drilling new wells, building platforms and pipelines, modernizing refineries). A red flag is when cash flow cannot cover CAPEX and dividends, forcing the company to take on debt — this happened in 2015–2016 when several majors had insufficient cash flow due to prolonged low prices. More efficient companies have managed to lower their break-even points and, in recent years, have emphasized capital discipline (investing only in profitable projects below a certain price threshold and returning excess cash to shareholders). Free Cash Flow (cash left after investments) is closely watched to assess the ability to pay dividends and buy back shares. For instance, after the 2020 pandemic, many oil companies focused on projects with a break-even ≤ $40 per barrel to ensure positive cash flow even in stress scenarios, and indeed, in 2021–2022 they generated record flows, allocating much of it to special dividends and share repurchases.
8.2 Profitability (ROE, ROCE):
Companies are traditionally evaluated by ROE (Return on Equity) or ROCE (Return on Capital Employed) to assess how efficiently they generate profits from their capital compared to other industries. However, due to earnings volatility driven by oil prices, it's helpful to average these returns over a full cycle. In good years, major oil companies can post ROEs above 20–30%, while in downturns they may drop to single digits or negative (due to losses).
8.3 Margins:
In upstream, net margin per barrel produced is a key metric. In downstream, the refining margin (e.g., dollars earned per barrel refined) is the star metric. Many refiners report the average crack spread (the margin from converting crude oil into a pool of products). For example, in 2022, refining margins soared to record highs due to post-Covid demand and limited capacity, boosting the profits of integrated refiners.
8.4 Break-Even & Lifting Cost:
A key upstream metric is lifting cost — the cost to extract a barrel — as well as project break-even levels. Break-even can be defined at various levels: operational (minimum price to cover direct operating costs), economic (to cover CAPEX and initial project investment), or even fiscal/national (price a producing country needs to balance its national budget).
Companies constantly strive to reduce their production costs per barrel. For example, large companies have been acquiring low-cost assets: in 2023, ExxonMobil acquired Pioneer Natural Resources and Chevron bought Noble Energy, targeting shale fields with estimated break-even costs of $25–$30/bbl to strengthen their portfolios. These moves reflect how they seek to improve operating margins by ensuring profitable production even under low-price scenarios. An investor should compare per-barrel costs across companies: a firm producing in Saudi Arabia or the Permian shale (low costs) is very different from one focused on ultra-deepwater or oil sands (high costs). Those with the lowest-cost asset base will have a competitive edge in a depressed market.
-
Cash Cost of Production: The cash cost to produce an additional barrel.
-
Marginal Cost of Production: The extraction cost for new projects.
8.5 Debt:
Oil can generate massive cash flows but also long periods of downturn. Therefore, it's important to analyze oil companies’ debt levels. Common ratios include Net Debt / EBITDA, Debt/Equity, and interest coverage. Companies with excessive debt face financial risk if prices drop and EBITDA falls. A well-known case is Pemex, Mexico's state oil company, which accumulated very high debt over the last decade and struggles when revenues decline.
In the private sector, many highly indebted shale independents went bankrupt or restructured after 2014–2016. Today, most major oil companies have reduced their debt, using 2021–2022 revenues to pay down liabilities. Ecopetrol, for example, noted in 2023 that every $10 change in Brent crude price significantly impacts its EBITDA and, therefore, its projected leverage — hence it maintains some financial flexibility. In general, a solid balance sheet with moderate debt gives a company resilience during a low cycle. Analysts should also monitor debt maturities (you don’t want to see large bonds maturing during a downturn) and the cost of debt.
8.6 Sensitivity to Oil Prices
Many companies report in their presentations the impact of a change in oil prices on their financial results. For example: “+1 USD/bbl in Brent = +$X million in annual EBITDA.” This elasticity varies: a purely upstream company will see almost a linear relationship between EBITDA and price, while an integrated company may offset some of the impact with refining operations. As an investor, it's important to understand that investing in oil companies is, to a large extent, a leveraged bet on the commodity’s price—both operational and financial leverage. A 10% increase in oil prices can lead to a much greater increase in net income, as many costs are fixed in the short term. This is why oil stocks are often more volatile than oil itself.
On the other hand, if prices fall below the break-even level, the company can quickly incur significant losses. A key metric to review is the cash flow break-even point — the oil price a company needs to cover its CAPEX and dividends. In 2020, many companies targeted ~$50/bbl or less. For example, Ecopetrol stated in 2022 that it had strategies to adjust investment and maintain financial balance with WTI below $50.
8.7 Reserves and Replacement
For E&P companies, a critical figure is the volume of proven reserves and the reserve replacement rate. Proven reserves (1P) indicate how many barrels equivalent the company is expected to produce in the future with a certain level of confidence. Dividing 1P reserves by annual production gives the reserves life index. If a company has 1 billion barrels in 1P and produces 100 million annually, its reserve life is ~10 years. It's desirable for this indicator to remain stable or increase over time via discoveries or acquisitions; if it consistently declines, the company is “consuming” its assets without replacing them. The reserve replacement ratio (%) is calculated as additions to reserves (discoveries + purchases – sales) divided by production during a given period. A ratio >100% means the company added more reserves than it produced (a good sustainability sign); <100% indicates it’s not finding enough and may face declining production in the long run.
Valuing reserves also requires analyzing their quality: natural gas vs. oil, or heavy vs. light crude (each with different commercial values). E&P company valuations often use metrics like EV/Barrel of reserves or EV/Barrel produced to compare how cheap or expensive a stock is relative to peers, though these metrics must be complemented by reserve profitability (you wouldn't pay the same for a barrel in the Arctic as in the Middle East). For instance, in 2023, large oil companies were trading around $10–$15 of enterprise value per barrel of 1P reserves, while ExxonMobil’s acquisition of Pioneer implied ~$7 per barrel of high-quality shale resources (2P+2C), considered an attractive valuation. In summary, producers must ensure a future — that is, sufficient reserves and projects to sustain or grow production in coming years. Without this, their cash flow will decline.
-
1P (Proven Reserves): >90% probability of recovery
-
2P (Proven + Probable Reserves): ~50% probability
-
3P (Proven + Probable + Possible Reserves): ~10% probability.
-
For pure exploration companies, it is recommended to use the Net Asset Value (NAV) of reserves.
-
NAV10: The "10" in NAV10 refers to a 10% discount rate. This rate is used in asset and project valuation to discount future cash flows to their present value. A 10% discount rate implies that the future income or benefits of the company's assets are being valued using a cost of capital or required rate of return of 10%.
-
Companies are valued based on their reserves and net assets, usually applying a 50% discount to NAV.
8.8 Other Sector-Specific Metrics
Some specialized indicators include the recovery factor (percentage of oil in a reservoir that can be extracted, which can rise with enhanced recovery techniques, thus adding to reserves), discovery cost (CAPEX per barrel added to reserves, reflecting exploration efficiency), and upgrading cost for heavy crude (cost to convert to synthetic crude). For refining, aside from margin per barrel, analysts look at refinery utilization rates (the percentage of capacity being processed; low utilization often implies weak margins). In marketing, key metrics include volume sold and margin per liter. For oilfield services companies, equipment utilization rates (active rigs, platforms) and contract backlog (future work committed) are important indicators.
8.9 Valuation Example
Consider ExxonMobil. An analyst would note that in 2022 it generated tens of billions in operating cash flow thanks to Brent at ~$100, with CAPEX around ~$20 billion, resulting in strong free cash flow partly allocated to dividends (Exxon is a dividend aristocrat, historically yielding ~5%) and share buybacks. They’d see that its 2022 ROCE was above 25% (very high after restructuring), compared to <10% in 2020. Net debt is relatively low, with Debt/Capital <20%, providing financial flexibility. Its production remained stable around ~3.7 mboepd, and it replaced >100% of reserves in recent years (thanks to discoveries in Guyana, for example). Its sensitivity: each $10 change in Brent price could translate into several billion dollars of change in net income. The analyst would also compare ExxonMobil’s EV/EBITDA valuation with that of Chevron, Shell, etc., to assess relative value. All this, combined with strategic considerations (Exxon has a diversified portfolio with low break-even projects but faces energy transition risks), forms the basis for an investment decision.
-
EV/EBITDA: Recommended maximum ~6x in a normalized cycle
-
FCF multiple: Recommended maximum ~10x
In summary, when analyzing an oil company financially, one must balance recent numbers (profits, debt, margins) with its future capacity (reserves, projects, strategy). This industry can be highly profitable but is cyclical; therefore, balance sheet strength and prudent management during good times to endure bad ones are key evaluation points.
9. Ways to Invest in Oil
There are various ways to invest in or gain exposure to oil, either directly through the commodity itself or indirectly via financial instruments or shares in oil companies. Each method has its own characteristics, risks, and advantages. Below are the main options:
9.1 Futures and Forwards Contracts
The traditional way to access the crude oil market is through futures. An oil futures contract is a standardized agreement to buy or sell a fixed quantity of crude oil (e.g., 1,000 barrels of WTI) at a price agreed today, with delivery on a specific future date. Futures are traded on organized exchanges like NYMEX (for WTI) or ICE (for Brent), providing transparency and liquidity. Investing in futures allows one to benefit from oil price movements without physically owning barrels — most speculators close their positions before maturity to avoid receiving or delivering oil.
WTI and Brent futures trade almost 23 hours a day from Monday to Friday. High volatility tends to occur during the U.S. market open (when economic data or the weekly EIA inventory report is released on Wednesdays), and during major events (OPEC meetings, geopolitical tweets, etc.).
Forwards, on the other hand, are similar to futures but traded over the counter (OTC), meaning privately between two parties (e.g., an airline and a bank locking in a future jet fuel price). Forwards can be customized in volume and date but carry higher counterparty risk (no clearinghouse involved). In both futures and forwards, investors must consider leverage (only a fraction of the contract’s value is deposited, but they are exposed to the full price movement) and the forward price structure:
-
Contango (futures priced higher than spot, typical with oversupply and high inventories)
-
Backwardation (futures priced lower than spot, typical in tight markets)
These curves reflect the cost of holding inventory and market expectations.
9.2 Oil ETFs and ETNs
For investors who don’t want to deal with futures directly, there are oil-linked ETFs (Exchange-Traded Funds) and ETNs (Exchange-Traded Notes). Oil ETFs trade on exchanges like stocks and replicate crude oil performance through futures or other derivatives. A popular example is USO (United States Oil Fund), which invests in short-term WTI futures. These funds offer direct exposure to oil prices through a simple share purchase.
However, commodity ETFs face the rollover challenge: when futures expire, they must sell and buy new contracts with later maturities, potentially incurring losses in contango markets. ETNs, in contrast, are debt notes issued by banks that track the price of oil. As debt instruments, they carry issuer risk but don’t suffer from rollover costs (the issuer replicates the index).
In short, ETFs/ETNs are easier for many retail investors than futures, but it's important to understand their structure (an ETF may diverge from spot oil prices due to rollover costs). There are also inverse ETFs (which rise when oil prices fall) and leveraged ETFs (2x, 3x the daily movement) for more speculative strategies — although these are intended for very short-term trading due to compounding risk from volatility.
9.3 Oil-Exposed Investment Funds
9.3.1 Active Funds
Many mutual or actively managed funds include oil-related positions. Some commodity funds invest in oil futures and derivatives within a diversified commodity portfolio. Others are sector-specific and invest in a basket of energy stocks (e.g., a global energy equity fund may include integrated oil majors, refiners, and natural gas companies). There are also private hedge funds that specialize in oil trading.
9.3.2 Oil Company ETFs
For individual investors, the most accessible option may be oil company ETFs, which track sector indices. For instance, XLE (Energy Select Sector SPDR) tracks an index of large U.S. oil companies; other global ETFs include international oil majors. These instruments allow investors to diversify across multiple companies with a single transaction, reducing single-stock risk. As with individual stocks, investing in oil company funds carries stock market risk but provides diversification within the energy sector.
9.4 Options and Other Derivatives
For more advanced investors, the market offers oil futures options and other exotic derivatives. Options give the right — but not the obligation — to buy (call) or sell (put) oil futures at a set price before expiration. For example, a refinery might buy call options to secure a maximum purchase price for crude, while a trader could buy puts to speculate on falling oil prices without the unlimited downside risk of short selling.
Options allow for hedging or leverage strategies with limited risk (only the premium paid). These are complex instruments: pricing depends on volatility, time to maturity, and intrinsic value. Understanding options requires knowledge of concepts like delta, theta, and implied volatility.
Other derivatives include:
-
Commodity swaps (OTC contracts that exchange cash flows based on oil prices, used for long-term hedging)
-
CFDs (Contracts for Difference) offered by brokers, which replicate oil price movements with leverage and are mostly used for very short-term trading.
Due to their complexity and leverage, these instruments are not suitable for beginners — it's recommended to first master spot markets, futures, or ETFs before exploring options.
9.5 Conclusion on Investment Modalities
A conservative investor seeking moderate exposure might choose shares in a solid oil company or a sector ETF, gaining dividends and positive oil correlation without the extreme volatility of the raw commodity. A more tactical short-term investor might prefer oil ETFs or even futures to take advantage of weekly or monthly price movements. Professional investors with specific needs (e.g., airlines hedging fuel, quantitative traders) will use advanced derivatives.
It is essential to choose an investment method that fits your knowledge, time horizon, and risk tolerance — options range from relatively stable instruments to highly speculative tools.
10. Conclusion
The oil and gas industry is complex and requires deep analysis to properly evaluate investment opportunities. Due to its cyclical nature, investors must consider factors such as production costs, reserves, reservoir life, and the macroeconomic environment.
Success in this sector lies in selecting companies with low operating costs, strong capital management, and well-defined strategies to mitigate oil price volatility.