
1.2 Economic agents and the circular flow of income
Who moves the money—and why won’t it stay put?
Why the economy looks more like a roundabout than a safe...
In the previous lesson we saw that resources are limited and choosing one thing means giving up another. Fine. Now for the next question, which looks simple until you try to answer it: who makes those choices, and how do they connect? Your salary doesn’t materialize by magic, your morning coffee doesn’t pay for itself, and the company you invest in doesn’t earn its revenue on a desert island.
The economy is a circuit. Money comes in, goes around, becomes wages, spending, taxes and sometimes savings—and then shoots off into somebody else’s pocket. When the circuit flows, you get jobs, sales and profits. When it jams, you notice it on the street long before it reaches the evening news.
Today we’re going to draw that circuit properly. A few words that sound suspiciously like an exam will turn up: agents, income, leakages and injections. Relax. Every one of them describes something you already do without giving it a technical name.
Economic agents: Who makes the decisions? 🎲
An economic agent is simply someone making economic decisions: how to earn, spend, produce or save. The word sounds like a spy movie, but its root means someone who acts. Economists use it to group millions of individual decisions into a few manageable characters. Nobody can track every purchase in a country; we can study households or businesses as groups.
There are four main players in this game, each pulling the blanket in its own direction:
-
Households: you and me. We supply labor, receive wages, buy things, pay taxes and, if anything remains at month-end, save. A student living with parents, a retiree or a couple with a mortgage all belong in this group.
-
Businesses: they produce goods and services, hire people, pay wages and seek a profit. They also invest in machinery, new shops or product development. The corner café and the listed multinational both count.
-
Government, or the public sector: it collects taxes, spends on healthcare, pensions, roads and public employees, and sets the rules. In Spain this includes local councils, regional governments, Social Security and central government. It isn’t watching from the sidelines; it is a very large player.
-
The external sector: the rest of the world. Spain sells olive oil, tourism and software abroad—exports—and buys phones, petroleum and cars—imports. It isn’t an apartment with the shutters permanently closed.
A fifth character doesn’t always get top billing, but matters greatly here: the financial system. Banks, insurers, funds, stock exchanges and bond markets form the pipes connecting people who don’t need their savings immediately with those wanting to spend or invest now. Without those channels, savings could remain under the mattress and the circuit would lose pressure. We’ll study the plumbing throughout module 2.
Income: What you receive for contributing to production 💶
Before drawing the roundabout, let’s clear up income. Income is not just a word on a tax return or another name for rent. In economics it is broader: what someone receives for contributing to production. Supply labor and receive wages; provide premises and receive rent; lend savings and receive interest; organize and risk money in a business and receive profit—or a loss.
Labor, land or premises, capital and entrepreneurship are factors of production: the ingredients needed to make things. Here is what joins the pieces together: what a company pays for these ingredients is simultaneously its cost and somebody else’s income.
The circular flow of income: Two markets, one roundabout 🔄
Imagine a roundabout connecting households and businesses through two main markets. Traffic never travels in just one direction.
First, the factor market. Households offer time, talent and savings. Businesses use these resources and pay income in return: wages, rent, interest and profit. That becomes somebody’s income. A market needn’t be a square full of stalls. A job website, an interview or a lease for business premises is already part of this market at work.
Then the goods-and-services market. Businesses produce bread, phones and car insurance; households buy them using their income. That is consumption. Sales revenue is often what lets businesses pay wages again, starting another round.
Let’s be honest: there’s no magic. The money you spend filling a supermarket trolley soon becomes somebody else’s wages. Part of those wages then reaches another business’s till. That is the circular flow of income: income doesn’t simply appear and sit in a safe; it circulates. The idea has a long history. In the eighteenth century, François Quesnay pictured the economy as circulation among social groups, often described as drawing inspiration from blood circulation. Modern textbooks use the model as a first map of macroeconomics.
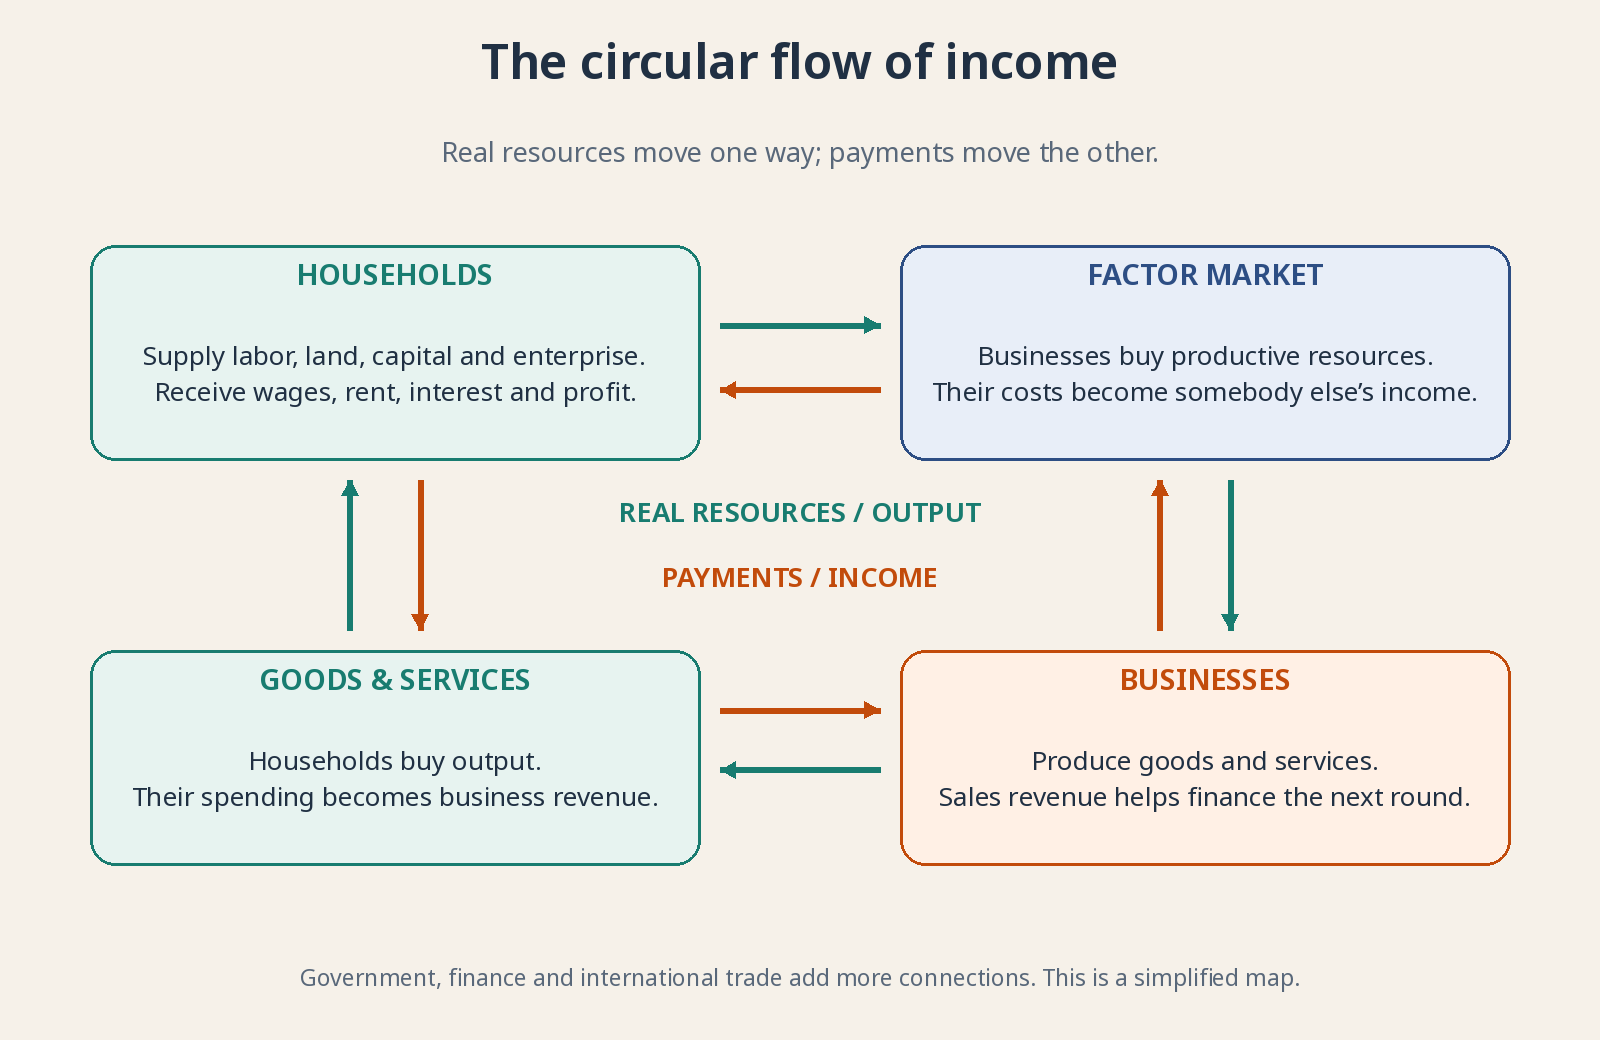
Green arrows show real resources and output; amber arrows show payments in the opposite direction. Government, finance and international trade add more connections. This is a simplified map.
One important warning: this is a simplified map, like a subway map. It doesn’t reproduce every bend in the tunnel. It tells you what connects to what. That is its job.
Where does GDP fit into all this? 📏
If you’ve heard “GDP grew by 2%,” this roundabout gives you a starting point. Gross domestic product, GDP, is the monetary value of final goods and services produced within a country over a period, usually a quarter or year. Final avoids double counting: count the bread bought by the consumer, not the flour’s full value again on top. Spain’s National Statistics Institute, INE, calculates and publishes it.
You can examine the same activity through spending on final output, the income generated by production or value added along the production chain. In principle these views agree because one person’s expenditure is another’s income. GDP isn’t “the country’s money” stored somewhere. It measures the value of what was produced during a period—activity on the roundabout, not a vault balance. Don’t mix it up with the velocity of money, which answers a different question: how many times, on average, the same euro changes hands during that period. The same GDP can come from a few euros changing hands often or from many euros changing hands rarely; GDP measures output, velocity measures how money circulates. You’ll see this in more detail in lesson 3.1. Nor is it a measure of happiness, unpaid housework or fair distribution. It is an activity thermometer, not a moral judgment.
More exits: Government, the rest of the world and savings 🏦
Two players are a useful start. Real life adds more connections.
Save €200 instead of spending it and that money initially leaves the consumption stream. Economists call this a leakage or withdrawal. Think of water leaving the main pipe before the tap. The familiar three are saving, taxes and imports. Saving is income not consumed; taxes go to government; imported shoes direct spending toward foreign production. Leakage doesn’t mean waste or something bad. Saving is sensible. The label describes where that euro goes in this simplified domestic-spending circuit.
Money can also flow back in. These additions are injections—new water entering the pipe:
-
Savings can help finance investment: a business loan, a bond issue or new equity. The useful macroeconomic injection occurs when somebody spends on machinery, new premises or product development to expand productive capacity. Buying an existing financial asset is different; we’ll separate those meanings below.
-
Government returns part of tax revenue through public spending: doctors’ and teachers’ salaries, infrastructure and equipment purchases.
-
A German visitor spending in Valencia, or a Spanish business selling abroad, generates export revenue: spending arriving from outside.
Each withdrawal has a corresponding injection category: saving and investment, taxes and public spending, imports and exports. That doesn’t mean their amounts always match. The differences are part of what makes the model interesting.
Saving and investment: Similar in conversation, different in economics 🧩
Here is a classic confusion. Everyday investing includes buying shares or an apartment. In macroeconomics, saving means not consuming part of income, while investment means spending on productive capacity: machinery, buildings, software or roads. Buy an existing share on the stock exchange and you transfer ownership of a financial asset. You haven’t directly created new productive capital. Real investment occurs when a business uses funds to expand that capacity.
Why distinguish them? Savings support the spending circuit when they help finance investment. If everybody tries to save more while nobody expands spending, businesses can sell less and total income can fall. This is the paradox of thrift, popularized by Keynes, which returns in lesson 1.4.
Transfers: Money changes hands without buying new output 🔁
One detail matters particularly in Spain, and in many other countries: some government spending doesn’t purchase current goods or services. These are transfers—pensions, unemployment benefits, scholarships and other support. Government collects from some people and pays others without receiving new output in that transaction.
Receiving a transfer isn’t itself production, so the transfer isn’t counted as new GDP. But it strongly affects the circuit: a pensioner uses that income to buy goods and services. Changing benefits or pensions changes both recipients’ lives and spending in local shops.
The roundabout rule: More coming in or more going out? ⚖️
The intuition is simple: if planned withdrawals exceed planned injections, spending and income come under downward pressure. Businesses sell less and may hire less; the economy cools. If injections exceed withdrawals, spending can accelerate. For a while sales may rise. If demand pushes beyond what the economy can supply, the result can also be inflation: a broad increase in prices. In the complete accounts, income and other adjustments bring the flows back into balance; the diagram explains the pressure behind those adjustments, not an accounting exception.
Why does this matter to you as an investor? 📈
Because company profits don’t fall from the sky. They come out of this circuit. If households get nervous and stop spending, government tightens its belt, overseas customers buy less or higher interest rates make credit more expensive, the roundabout loses traffic. As it empties, income statements—the reports showing a company’s revenue, expenses and profit—start to look thinner.
That’s why analyzing a company as if it lived in a sealed aquarium makes no sense. In this course we use quality clues such as ROE above 15% or a net margin above 10%. ROE, return on equity, measures profit relative to the owners’ equity capital. Net margin tells you how many cents of each euro of revenue remain as profit after everything is paid. We’ll explore both later. First ask who buys the product: financially squeezed households, a government cutting spending, or an overseas market that is closing?
Interest rates are the traffic lights on this roundabout. A rate is the price of borrowed money: what you pay to use somebody else’s money today, or receive for lending yours. Higher rates make credit-funded spending and new factories more expensive; people brake. Lower rates can get traffic moving. This isn’t about predicting the central bank’s next move or timing the perfect entry and exit. It is about understanding why profits can weaken even when the product is still good: the surrounding flow has slowed.
Understand this map and the stock market starts to look like a thermometer of real people earning, spending, saving and paying taxes. GDP, inflation, policy and cycles are ultimately different ways of studying how that roundabout speeds up or gets blocked.