
2.3 Money supply (M1, M2, M3): Measuring liquidity
How much money is there if most of it is just numbers on a screen?
Counting banknotes won’t tell you how much water is flowing through the pipes...
Let’s be honest: “there’s lots of money in the system” sounds decisive until you ask what somebody is counting. Banknotes? Checking accounts? Deposits that mature in a year? Funds? Move the edge of the bag and the answer changes quite a bit.
Lesson 2.2 showed us that most money isn’t banknotes but deposits created through bank lending. The reserves lesson showed us that banks also hold their own settlement money at the central bank. So the honest answer to “how much money is there in the euro area?” starts with another question: what are you counting as money?
The money supply is the quantity of money in an economy under a particular definition. “Supply” means the amount available, much as it does in the housing market. Because several definitions are useful, central banks publish monetary aggregates: totals grouping instruments by how readily they can be used to pay. M1, M2 and M3 take their M from “money.” They aren’t competing to be the one true number. Each lights up a different part of the circuit.
Liquidity: Not everything valuable is equally easy to spend 💧
Liquidity is how readily you can use something to pay or convert it into money without a substantial delay or price loss. Imagine plumbing: some funds are already at the tap; others need several valves opened first. Monetary aggregates group instruments partly by how close they are to immediately usable money.
Counting money is not the same as adding up national wealth. Shares, property and machines can be valuable without belonging to standard money measures. Being traded on an exchange does not make a share money either. Its price can fall precisely when you need to sell. Value and readiness for payment are separate properties.
Picture widening circles. The center contains immediately spendable money; outer layers include instruments with conditions or maturities. Near money, or quasi-money, describes assets close to spendable balances but not identical to them. Wider definitions are useful for different questions, not rival attempts to reveal one secret true total.
Demand and time deposits: Your checking account vs. your fixed-term deposit 🏧
Two familiar deposit categories appear repeatedly in these definitions. The distinction is about access to the balance, not whether the bank’s app makes both accounts look equally convenient:
-
A demand deposit is available for withdrawal or transfer without an agreed notice period, subject to the account’s terms. Your current or checking account is the familiar example. It supports ordinary payments directly. For statistical comparisons, check the specific category used rather than assuming every product called a savings account is treated identically.
-
A time deposit commits funds for an agreed term, such as six months or a year, usually in exchange for specified interest. Early access may involve a penalty or may not be allowed. It remains your financial asset, but it is less immediately usable than an unrestricted transaction balance.
A notice deposit requires advance notice before withdrawal. It sits between immediate access and a fixed maturity in everyday terms. The exact notice period matters for monetary classification, so read the product and statistical definitions rather than relying on the marketing name.
The monetary base: Not just another box inside all the others 🏦
The monetary base is central-bank currency plus banks’ reserves, with details depending on the statistical framework. You may see it called M0, although labels are not universal. Currency and reserves are forms of central-bank money; household bank deposits are liabilities of commercial banks. Similar-looking numbers belong to different institutions’ accounts.
Don’t draw the base as simply the innermost public-money circle inside every other aggregate. Bank reserves are not deposits households can spend, while currency can overlap with broad-money measures. The base and monetary aggregates therefore overlap without being a tidy chain of nested boxes. The diagram separates them for a reason.
Large central-bank bond purchases can increase reserves and expand the base without producing a fixed proportional increase in loans or public deposits. Banks still face capital, funding and risk constraints, and customers must want suitable loans. More settlement money does not compel another mortgage. A fixed multiplier is a model assumption, not an operating instruction.
M1, M2 and M3: Widening the circle 🧅
For the euro area, the ECB defines progressively broader aggregates within a specified institutional and residency perimeter. The money-holding sector excludes central government and monetary financial institutions, among other technical qualifications. Start with the categories below, but remember that an official aggregate is more precise than “everything in every bank account.”
-
M1, narrow money, includes currency in circulation and overnight deposits within that framework. This is the layer closest to immediately usable payment balances. The currency component is included under the statistical rules; the measure is not a count of cash physically sitting in each resident’s wallet.
-
M2 adds deposits with agreed maturity up to two years and deposits redeemable at notice up to three months. These balances remain close to money, but you may not be able to spend them directly at the checkout. Their access conditions explain why they are outside the narrowest layer.
-
M3 adds specified marketable instruments to M2: repos, money-market fund shares or units, and debt securities with maturity up to two years. Money-market funds invest in short-term instruments; they are not riskless substitutes for every bank deposit. Inclusion in a monetary aggregate describes statistical characteristics, not a guarantee against loss.
Several measures help distinguish immediately spendable balances from broader liquid holdings. Moving funds from a current account to an included time deposit can reduce M1 without reducing M3. The ECB has traditionally examined broad money alongside other evidence. A wider aggregate can reveal movements hidden by a narrow measure alone.
Do not add M1, M2 and M3 together. M2 already includes M1, and M3 includes M2. Adding them would count the same balances repeatedly. Moving the apples into a larger basket doesn’t mean you bought another set of apples.
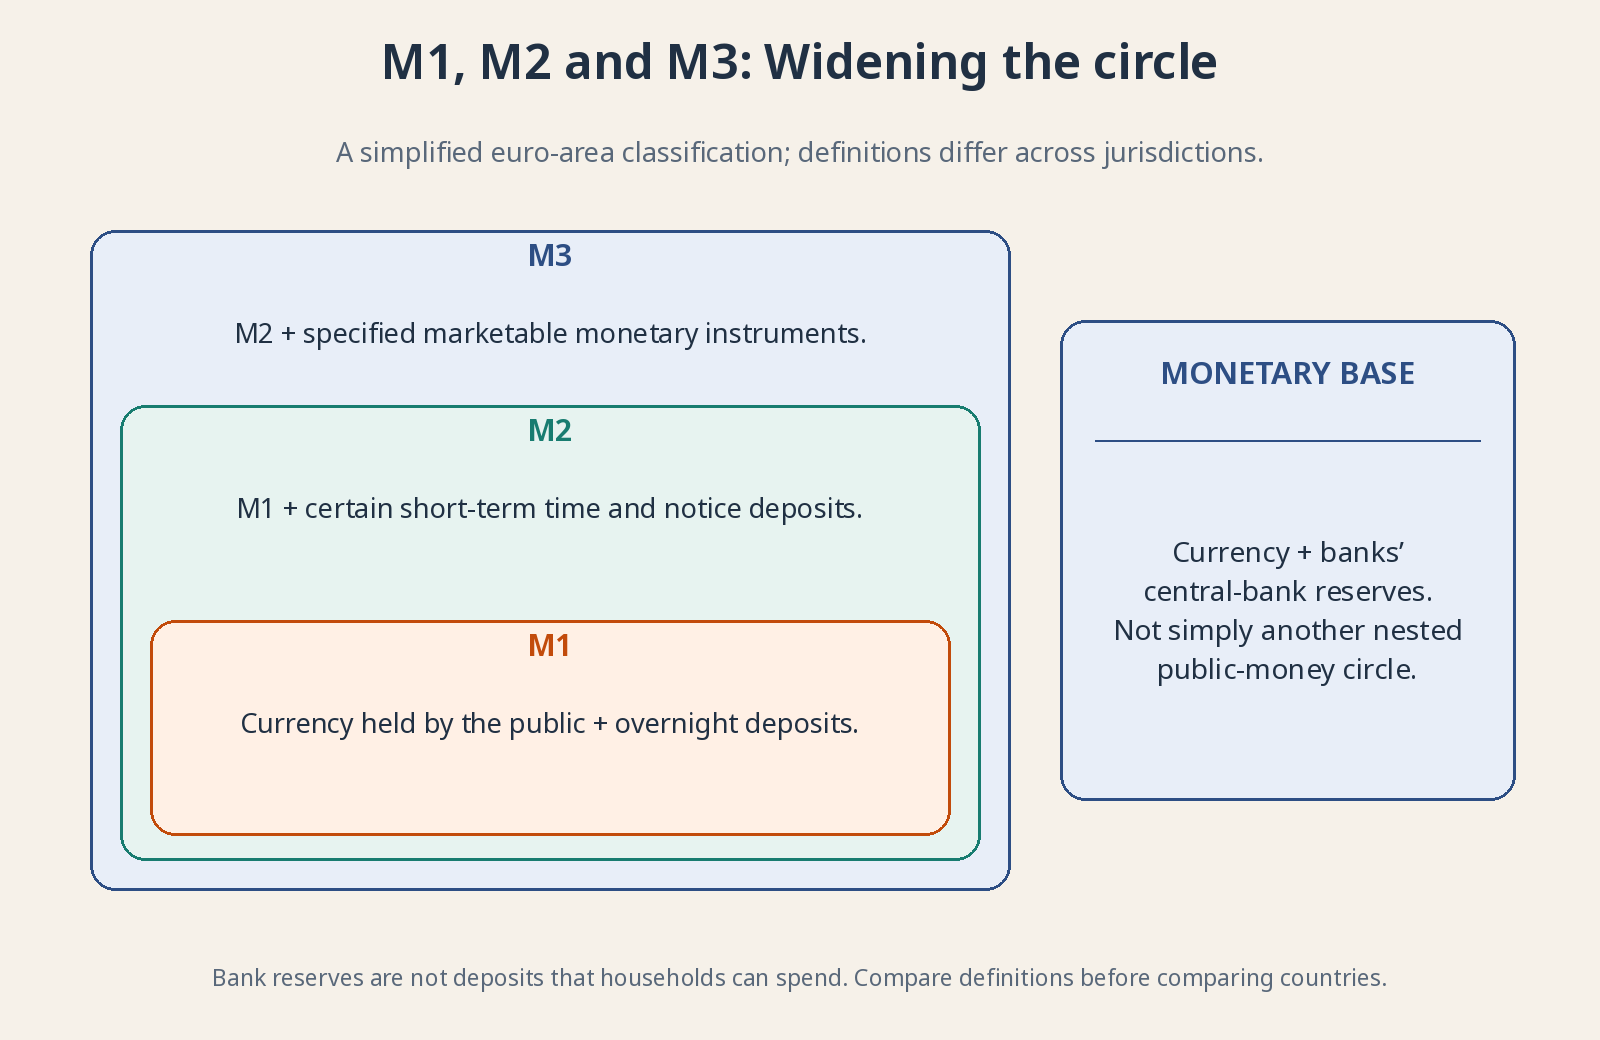
Bank reserves are not deposits that households can spend. Compare definitions before comparing countries.
Definitions differ across countries and change over time. The US stopped publishing its official M3 in 2006. A 2020 change expanded the US M1 definition to include savings deposits, creating a major statistical jump without an equivalent overnight burst of new money. Compare methodology before treating two lines with the same label as the same thing.
More money doesn’t automatically mean more inflation 🔍
Persistent growth in spendable money relative to productive capacity can increase inflation pressure. But the link depends on money demand, spending, credit, output and expectations. A balance parked for safety is not the same as immediate demand for scarce products. Monetary figures help explain conditions; they don’t specify tomorrow’s exact price increase.
Velocity describes money’s use relative to economic activity; in macro analysis it is commonly represented by nominal output divided by a chosen money stock. As a simple payments analogy, picture one €50 note going from a customer to a bar, from the bar to its supplier and from the supplier to an employee within a month: three payments, €150 in total from a single note. If it stays in a drawer, none. This illustrates how money circulates; it isn’t a calculation of output. Those €150 of payments aren’t €150 of GDP: the employee’s wage is income, and what the bar pays its supplier covers ingredients already inside the price of the customer’s drink. Adding everything up as production would count the same thing twice, which is why GDP only counts final goods and services, as you’ll see in lesson 3.1. There is no rule that M2 rising 10% makes every price rise 10% tomorrow. In a crisis, precautionary cash accumulation can reduce velocity: a large money stock can coexist with weak spending.
Composition also matters. Higher deposit rates can encourage households to move funds from checking accounts into time deposits. M1 may fall while the broader liquid balances included in M2 remain. Before announcing that money has vanished, inspect which categories changed, why people moved funds and whether the broader total tells the same story.
Why does this matter to you as an investor? 📈
Because monetary conditions influence spending, financing and willingness to take risk. Easier conditions can support activity and valuations; tighter ones can constrain them. But abundant liquidity can also reflect fear or emergency action—not a party you’ve discovered before everyone else.
Monetary aggregates provide context, not automatic stock-market entry and exit signals. Combine them with credit, real interest rates, inflation and company reports. A real rate is approximately the nominal rate minus inflation: a deposit paying 3% against 4% inflation loses roughly 1% in purchasing power. Also distinguish statistically measured money from market liquidity: the ease of trading a stock or bond without moving its price much.
Your edge isn’t predicting the next M3 release. It’s avoiding fragile businesses whose survival assumes permanently easy financing, and recognizing that money creation outpacing real output can erode purchasing power. The broader transmission still matters; it isn’t an automatic one-for-one equation. A long horizon, sensible valuations and regular contributions are a plan. Treating every money chart as a treasure map is rather less convincing.