
3.5 The labor market: Unemployment and Nonfarm Payrolls (NFP)
Is unemployment falling because there’s more work—or less job hunting?
Unemployment, Spain’s EPA and US NFP: Counting people isn’t the same as counting jobs.
Let’s be honest: few statistics get waved around as enthusiastically as unemployment. Down one month? Time for a photo opportunity. Up the next? Time for a creative explanation. Behind the percentage are three different questions: how many people are working, how many are looking for work and how many are outside the labor force. Mix those up and you can celebrate an improvement that isn’t one.
Today I want to discuss the unemployment rate and the famous US Nonfarm Payrolls, or NFP. They aren’t two names for the same indicator. One counts unemployed people within a defined group; the other estimates payroll jobs. Both matter because employment connects output, wages, spending and central-bank decisions.
Employed, unemployed and inactive: Start with the right drawer 👥
An employed person meets the survey’s work criteria, which can include self-employment and specified temporary absences. An unemployed person has no qualifying employment, is available and is actively seeking work under defined rules. Wanting a job is not always enough to count as unemployed. Classification comes before the headline percentage.
The labor force consists of employed and unemployed people. Those outside it are economically inactive under that definition, potentially including retirees, students not seeking work and people occupied with care responsibilities. Inactive is a statistical category, not a judgment that someone does nothing useful. Household work and unpaid responsibilities still matter.
The unemployment rate is unemployed people divided by the labor force, multiplied by 100. In an invented population of 100, with 60 employed, 10 unemployed and 30 inactive, the labor force is 70. Unemployment is therefore about 14.3%, not 10%. Changing the denominator changes the answer completely.
Participation: Who enters and leaves the denominator? 🚪
The participation rate compares the labor force with a specified population. Spanish headline comparisons commonly use people aged sixteen and over; other countries and international series use different age ranges. Check ages and coverage before ranking countries. A common label does not guarantee an identical denominator.
If five unemployed people stop searching without finding jobs, employment remains 60, unemployment becomes five and the labor force becomes 65. The unemployment rate falls to about 7.7%, but no job has been created. Participation also falls. Discouragement, education, care or other reasons may explain the exits; the percentage alone cannot tell you which.
The reverse can happen too: improving job prospects draw people into searching, temporarily increasing unemployment while employment grows. The employment-to-population rate adds another perspective by comparing employed people with the relevant population. Read the three measures together rather than demanding that one headline describe every movement.
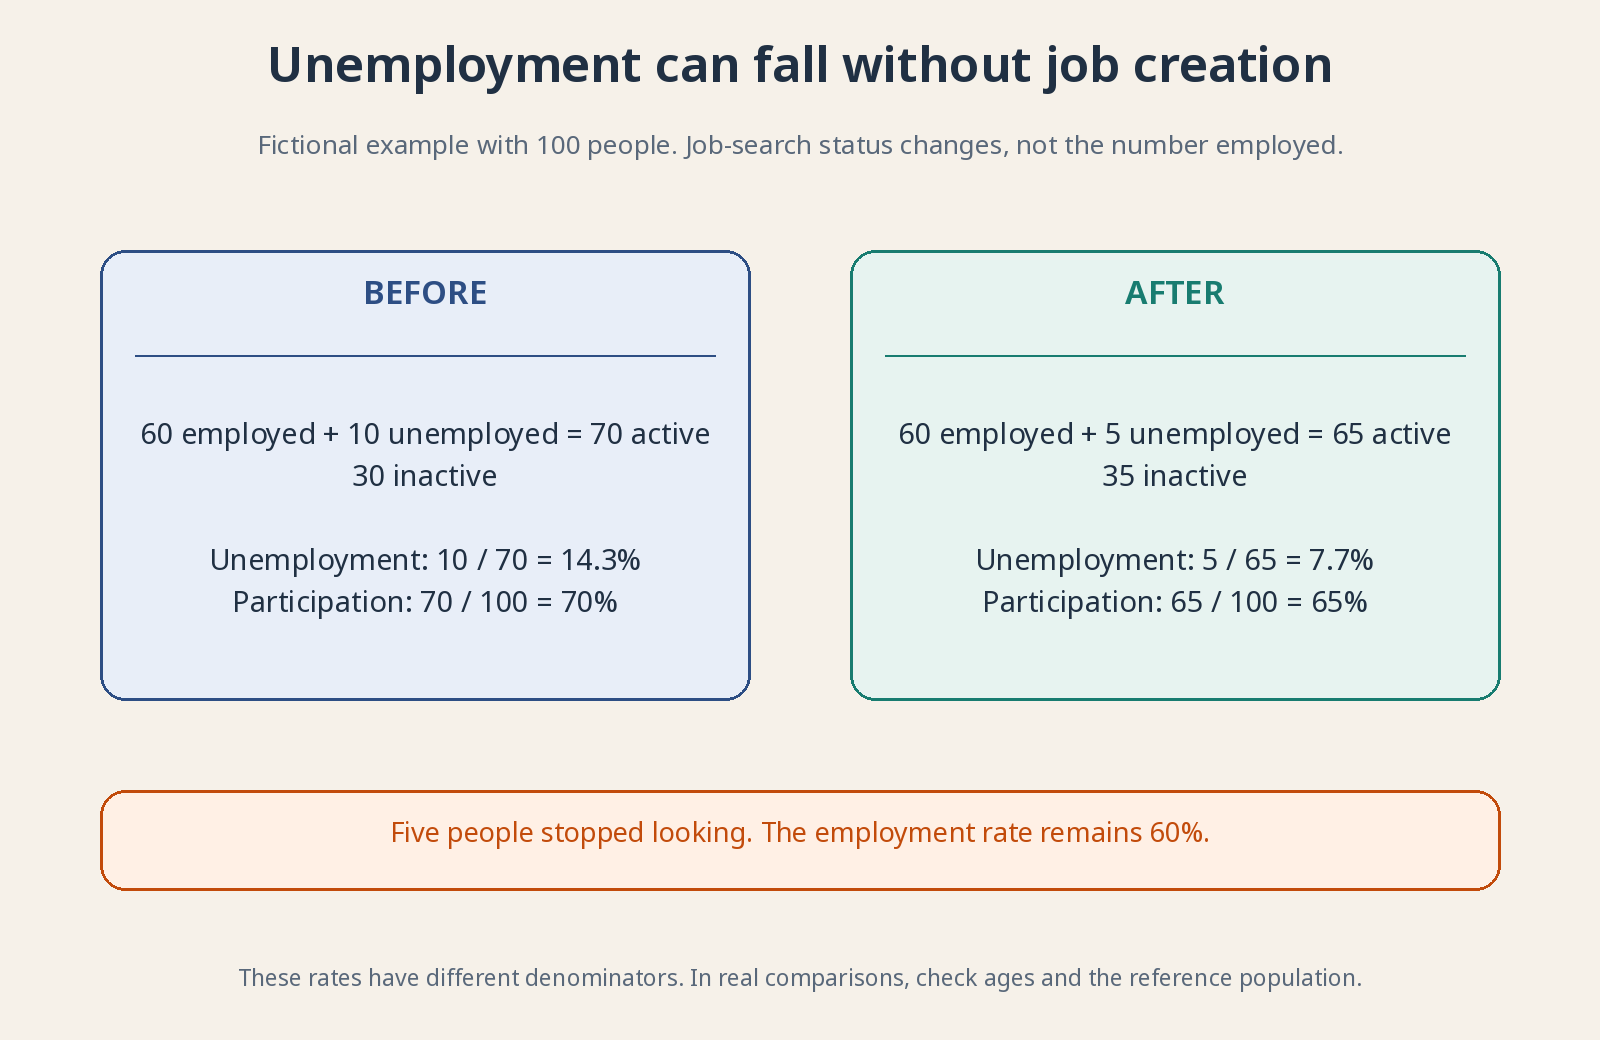
Labor-force participation uses a different denominator: the relevant population. State it explicitly.
Spain’s EPA: Surveying households, not just counting registrations 🇪🇸
Spain’s EPA, Encuesta de Población Activa or Labor Force Survey, is INE’s quarterly household survey of labor-market status. A selected sample is interviewed and used to estimate the wider population. Sampling is not counting every household; it involves uncertainty and methodological rules. That is normal statistical practice, not an automatic reason to dismiss the results. Sampling uncertainty becomes especially important for small population groups.
Under the EPA’s general unemployment definition, active search concerns the preceding four weeks and availability generally means being able to start within two weeks after the reference week. Methodological exceptions apply, including specified cases involving an already arranged start. These rules explain why everyday descriptions and survey classifications can differ.
Registered unemployment uses public employment-service administrative records and their eligibility rules. Social Security affiliation records provide another administrative view. They are valuable but are not interchangeable with the EPA’s population estimates. Different definitions, timing and coverage can produce different totals without one series necessarily being wrong.
Being employed does not describe job quality completely. Hours, contract duration, wages and involuntary part-time work add essential information. Someone working fewer hours than desired can still count as employed. A lower unemployment rate therefore does not establish that every worker has secure, adequately paid, full-time employment.
NFP: What’s behind the acronym that moves markets? 🇺🇸
NFP stands for Nonfarm Payrolls. Headlines usually refer to the monthly change in US nonfarm payroll employment, not the amount employees receive in wages. Payroll here identifies jobs in covered establishments. The level and its change are different statistics, so check which one the report is discussing. A monthly increase represents net job growth, after employment losses as well as additions—not simply the number of new hires.
The US Bureau of Labor Statistics, BLS, publishes the Employment Situation using two main surveys. The establishment survey, CES, measures payroll jobs, hours and earnings. The household survey, CPS, classifies people as employed, unemployed or outside the labor force and supplies unemployment and participation measures. Their units and coverage differ.
Nonfarm defines the payroll universe; it does not mean agriculture is unimportant or absent from all labor statistics. Nor does it cover every remaining kind of work. Exclusions include unincorporated self-employed workers, private-household employees and unpaid family workers. Understanding those exclusions prevents a payroll count being mistaken for all people doing work.
The payroll measure includes covered public- and private-sector jobs, not just factories or private businesses. Examine the sectors contributing to a monthly change. Growth concentrated in a few activities may be less broad than the total suggests, while weakness in one industry need not describe the whole labor market.
Jobs vs. people: One person can appear twice 🧮
A person holding two payroll jobs at different establishments can be counted once for each job in CES, while CPS counts one employed person. This helps explain why payroll jobs and household-survey employment need not move identically each month. Different samples, definitions and measurement uncertainty also contribute.
Hours and average hourly earnings provide additional clues. A firm may cut hours before dismissing staff. Average earnings can rise partly because lower-paid jobs disappear, changing the workforce mix—not because every remaining employee received a raise. Separate changes in pay rates from changes in who is included.
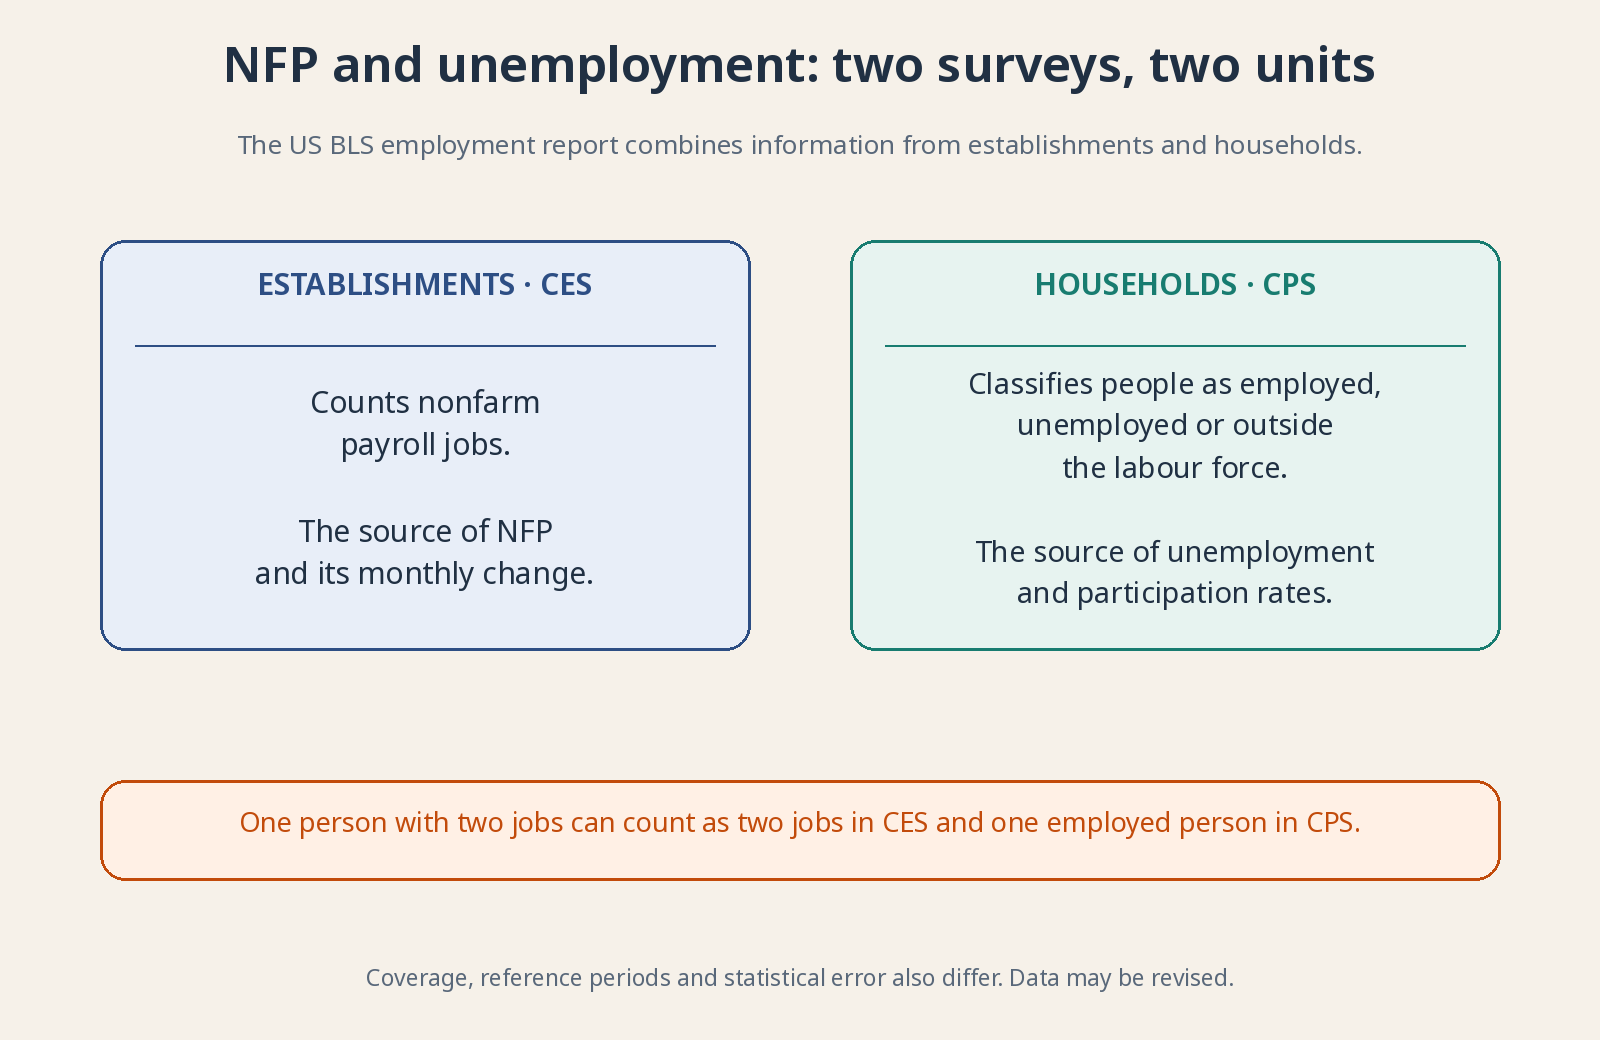
Different coverage, samples and revisions mean the two series need not tell identical monthly stories.
Revisions: The first photograph is still coming into focus 📷
Initial payroll estimates are revised as more responses arrive and seasonal factors are updated. The previous two months are routinely revised; an annual benchmark uses administrative records to improve the estimated employment level. An early release is a timely estimate, not a fully completed census immune to later information.
Seasonal adjustment tries to remove recurring calendar movements, such as predictable hiring campaigns. An increase in adjusted employment means improvement relative to the estimated seasonal pattern. It is not necessarily identical to the raw increase in people or jobs during that month. Compare adjusted with adjusted, and unadjusted with unadjusted.
Large revisions should change your reading of the earlier picture. They do not by themselves prove manipulation: surveys have incomplete responses and require estimation. Examine several months and cross-check other sources. Speed and perfect completeness rarely arrive together, particularly when measuring a labor market of this scale.
Why good jobs news can be bad stock-market news 📉
Markets compare the release with expectations, not merely with zero. Stronger employment can support expected sales while also suggesting tighter monetary policy if inflation pressure persists. Those forces can pull asset prices in opposite directions. A good economic headline therefore does not mechanically imply an immediate stock-market gain.
Structural unemployment concerns persistent mismatches involving skills, location, institutions or the matching of vacancies and workers. NAIRU—the non-accelerating inflation rate of unemployment—is a model-based estimate associated with stable inflation under specified conditions. It is uncertain, can change and is not a directly observed or desirable quota of unemployment. The Phillips-curve lesson returns to it.
Why does this matter to you as an investor? 📈
Because jobs support income and consumption but also create costs for businesses. A company can sell less when its customers lose work, or earn less when hiring costs rise faster than it can raise prices. Look at jobs, hours, pay and participation, then connect those clues to the specific business.
You don’t need to bet on the first market reaction to a US report. You need to distinguish an economy bringing people into work from one where unemployment falls because people give up searching. That improves your understanding of the cycle without turning a long-term portfolio into a monthly survey of your nerves.
For further reading: INE: Labor Force Survey (EPA) methodology · BLS: technical notes and revisions · BLS: comparison of household and establishment surveys.