
Producer Price Index (PPI) as a leading indicator
Before the supermarket, there’s a factory changing its prices too
PPI: A clue about what may come next, not a machine for predicting CPI.
Let’s be honest: when bread gets more expensive, the argument usually starts at the counter. But long before that, somebody may have paid more for flour, electricity or transport. Watch only the final price and you arrive halfway through the movie. That’s why economists also watch prices earlier in the chain.
Today I want to talk about the Producer Price Index, or PPI. It isn’t an asset you can buy, or the price of one particular raw material. It is a family of statistics tracking the prices producers receive for their output. “Producer” tells you where the price is observed—not who ultimately bears every part of the cost.
From factory to shopping basket: Not the same bill 🏭
CPI tracks covered household consumption prices. Producer-price measures examine an earlier stage or a different part of the economy: the prices producers receive for output. They grew from the need to monitor industrial and production prices, not from a desire to predict every supermarket bill. The stage of observation matters as much as the name.
Spain’s INE publishes the Industrial Price Index, known locally as IPRI. Its domestic-market measure follows industrial products manufactured and sold in the domestic market at the first marketing stage, often called factory-gate prices. It excludes VAT and specified other invoiced indirect taxes under its methodology. This is not the final retail receipt. VAT means value-added tax, a consumption tax applied under the relevant system. Industrial coverage also does not represent every service produced in the economy.
Imported goods do not automatically become domestic production in that measure. INE publishes separate industrial import and export price statistics. A Spanish manufacturer can face much higher imported-component costs even if the domestic IPRI tells a milder story. You need the series that covers the exposure you are actually studying.
Suppose a factory sells a table for €100 and the consumer pays €160 after transport, storage, distribution margins and taxes. If the factory price rises to €110, the final shop price need not rise exactly 10%. The remaining components can change too. A percentage at one stage is not automatically the percentage at every later stage.
A production basket, not a grocery list 📋
An index combines representative products using weights reflecting their economic importance within the covered activity. A large industry contributes more than a small one. Comparable specifications and quality adjustments help separate price changes from changes in the product. As with consumer indices, a statistical basket is not simply an unweighted list of observations.
Industry groupings help locate pressure. Intermediate goods become inputs into other production, such as components or chemicals. Capital goods include equipment used to produce output. Consumer goods are closer to final household use, while energy has its own importance across the chain. Different categories need not move together or pass through at the same speed.
A producer’s selling price is neither its full cost nor its profit. A firm raising prices 4% can still lose margin if costs increase faster. Another can maintain prices while saving energy. To analyze profitability, compare revenue, input costs, productivity and volume rather than treating a producer-price index as an earnings report.
Why PPI can send an earlier warning ⏳
A leading indicator sometimes moves before another variable of interest. Producer prices may warn of pressure reaching consumers because production and distribution form a chain, while contracts delay adjustments. Passing a cost on means recovering it through the next selling price. It is a possible transmission mechanism, not an automatic entitlement to charge more.
Imagine a food processor renegotiating supermarket contracts once a year. Packaging becomes more expensive immediately, while the agreed selling price initially stays fixed. At renewal it may request an increase. One price change can therefore precede another. The delay comes from business arrangements, not a universal countdown embedded in the index. Inventories add another delay: goods sold today may have been purchased at yesterday’s input costs.
Leading does not mean infallible or fixed-lag. Strong consumer demand can raise retail prices and factory orders together. Sometimes pressure starts downstream and travels back toward producers. A shock can also hit several stages simultaneously. Treat the observed sequence as something to investigate, not proof that every future CPI move has already been revealed.
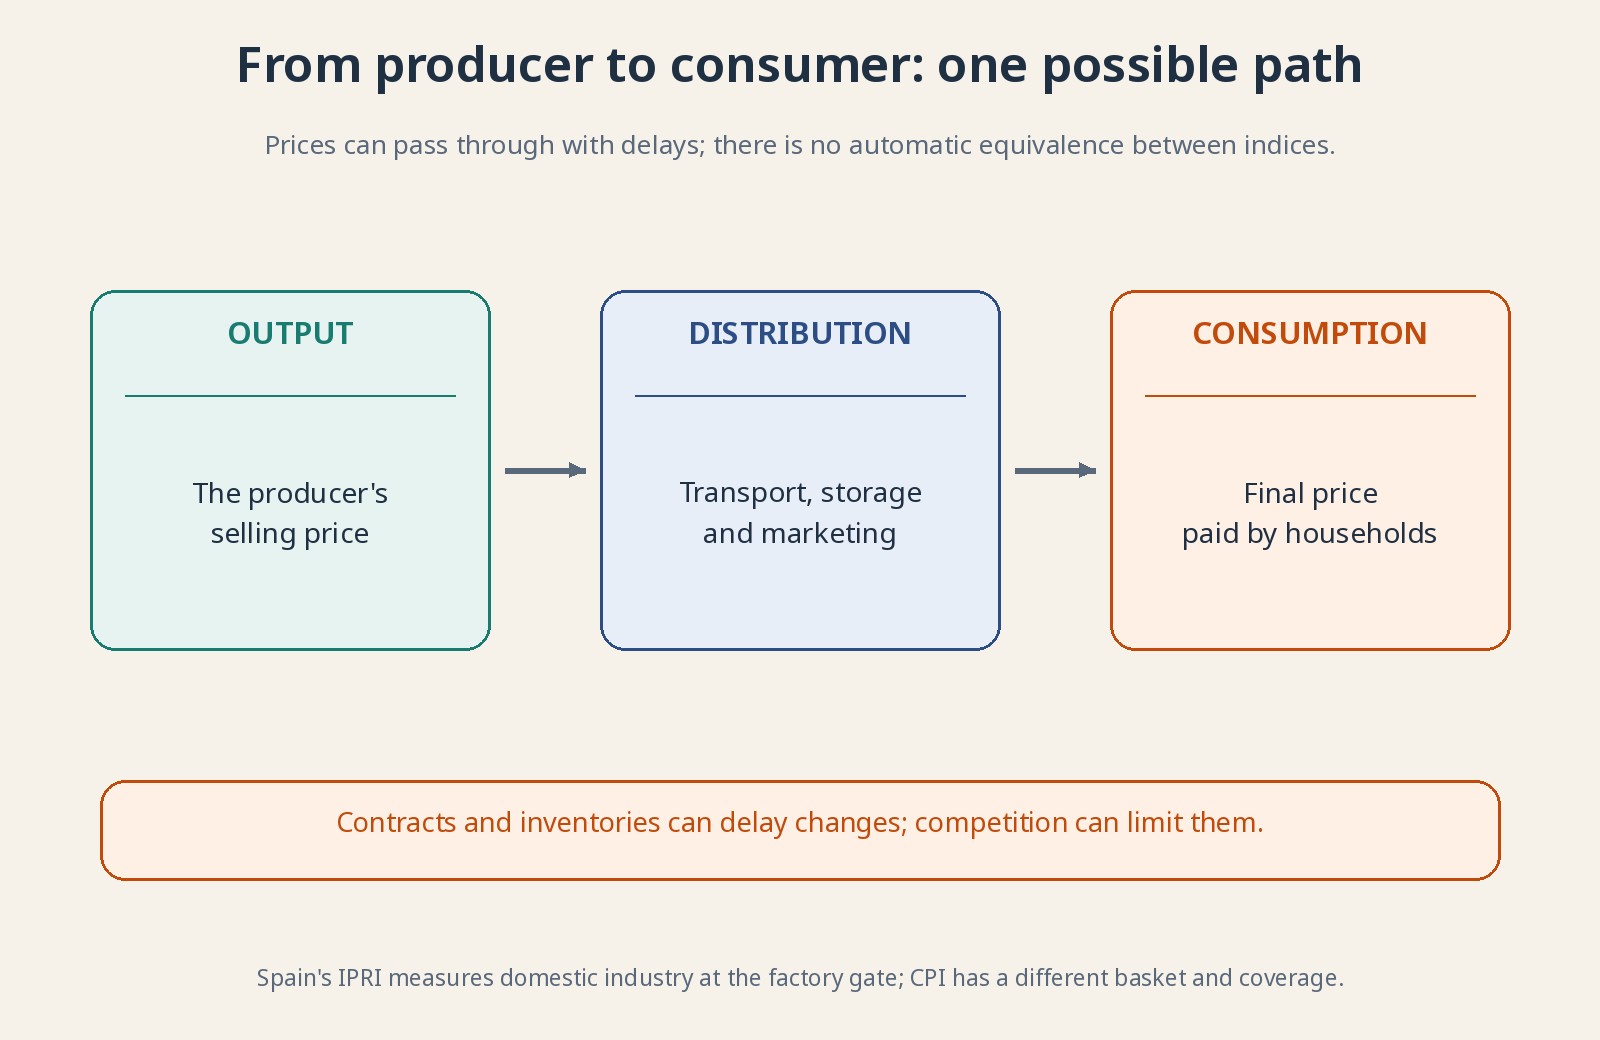
Producer prices can lead consumer prices, but the relationship is neither automatic nor one-for-one.
Five filters that can interrupt the transmission 🧱
The first filter is margins. A business may absorb higher costs rather than lose customers, particularly where competition is intense or demand weak. Different margins subtract different expenses, but the basic question is the same: who bears the increase? Producer prices can rise without the full change reaching the final consumer.
The second is productivity: output per unit of resources. More efficient machinery can offset some higher input costs. Firms can also change suppliers, design or product composition. Those responses affect the bill, although not every substitution preserves quality or is easy to measure. A production chain can adapt instead of transmitting the shock unchanged.
The third is taxes and subsidies. A VAT change or public price support can alter what a consumer pays without an identical factory-gate movement. A subsidy is public support affecting costs or the price faced by someone in the chain. Its incidence, design and duration matter; it does not make the underlying resources free.
The fourth is international exposure. A retailer importing a finished product may respond more to foreign prices and exchange rates than to domestic industrial output prices. Currency depreciation can raise local import costs. A national producer index therefore cannot summarize every pressure experienced by businesses selling to that country’s consumers.
The fifth is coverage. Many CPI services are not industrial goods at a factory gate: tutoring, repairs or restaurant meals combine different inputs. Wages, premises costs and local demand can matter more than the relevant industrial categories. Even perfectly measured indices cannot transmit one-for-one when they describe different baskets.
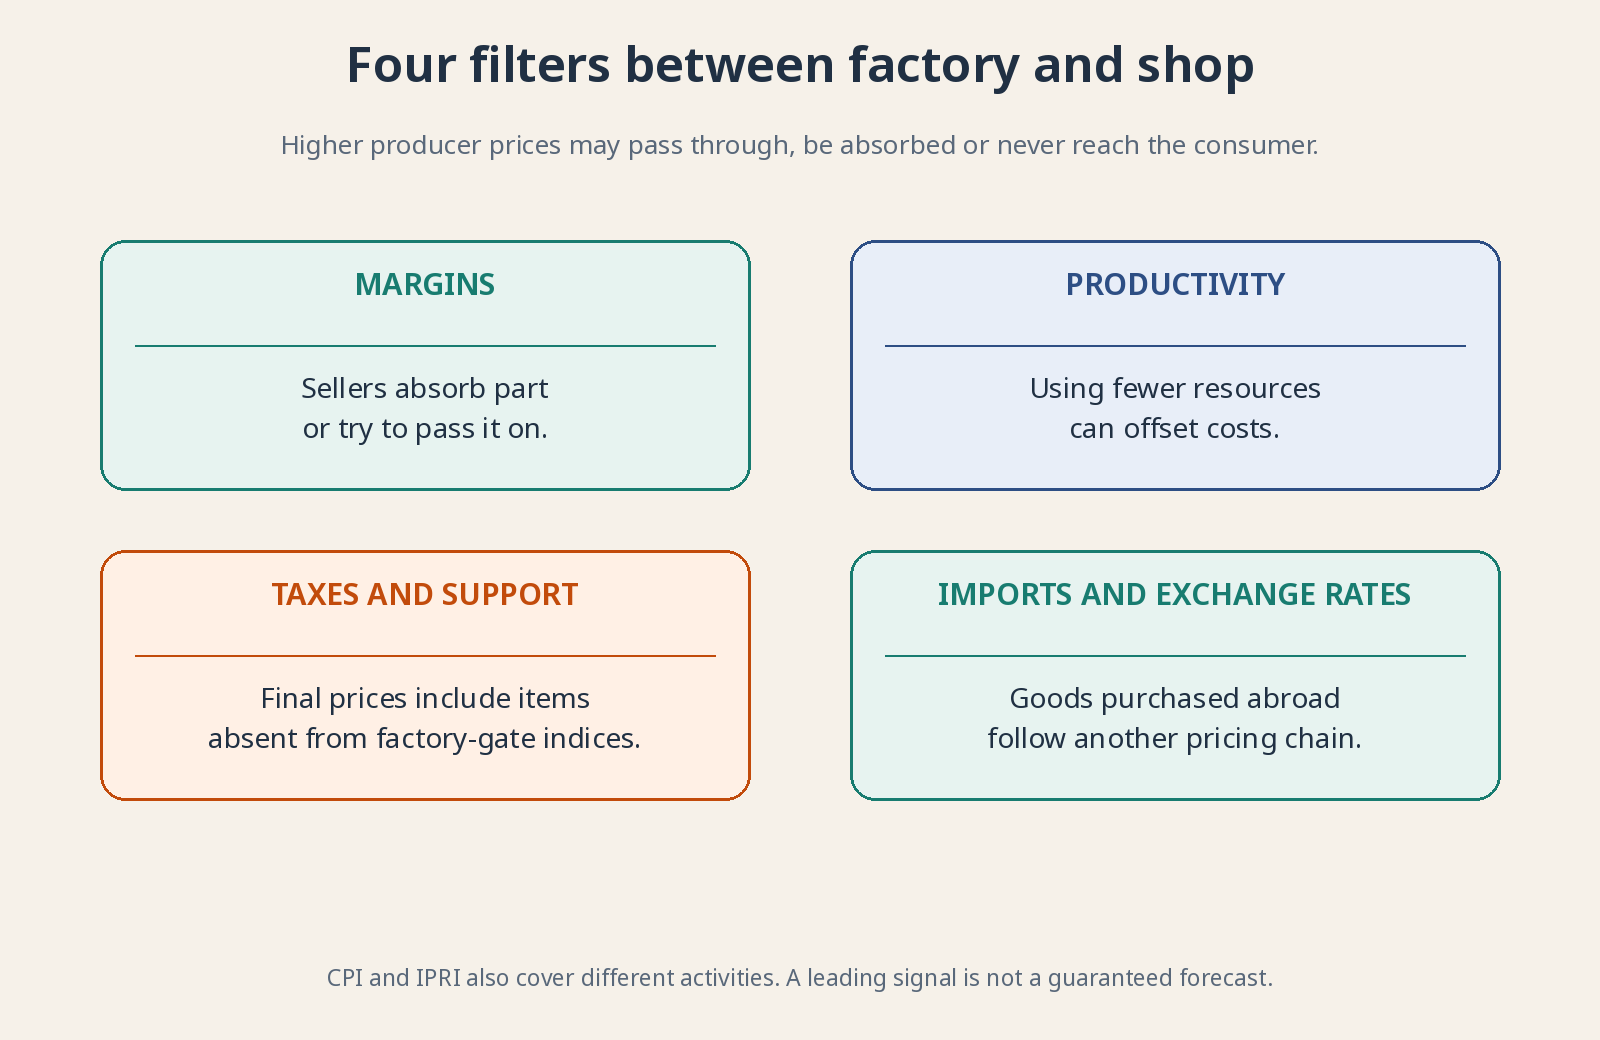
Different contracts and adjustment lags add more uncertainty. PPI is a clue, not a CPI forecasting machine.
US PPI and Spain’s IPRI: Don’t translate the labels blindly 🇺🇸
In the US, the Bureau of Labor Statistics, BLS, publishes PPI measures covering domestic goods and many services, with construction included in specified areas. Final-demand and intermediate-demand presentations organize prices by how the output is used. They are not identical to a consumer basket or simply an American translation of Spain’s industrial IPRI.
That broader US coverage is why its PPI can contain services absent from Spain’s industrial index. European series also distinguish domestic-market, foreign-market and total industrial prices, with separate service statistics. Before comparing countries, identify the sector, market and pricing stage. The translated title alone is not enough.
Some producer-price measures exclude volatile components, including food or energy. That does not turn them into consumer core inflation. They remain producer measures with their own coverage and weights. Write the definition beside the number in your notes. It prevents an impressive-looking comparison from joining two different questions.
Reading the release without chasing every decimal point 🔎
Start with the source, country, coverage, reference period and seasonal-adjustment status. Then separate the index level from its change. An index falling from 120 to 118 has declined from the previous observation but remains above its reference level of 100. Index points are not euros, and the level is not itself an inflation rate. A lower year-on-year rate may also reflect a base effect if the comparison month was unusually expensive.
Next inspect composition. A fall concentrated in energy differs from broad declines across many industries. Examine several periods because one month may reflect an unusual contract, calendar effect or temporary disruption. Trend and breadth are more informative together than a dramatic headline number on its own.
Price data are not volume data. Falling industrial prices might reflect cheaper inputs, or weak orders forcing firms to discount inventories. Distinguish those stories using output, sales volumes, orders and company reports. Cheaper production and collapsing demand can produce similar price movements with very different consequences for earnings.
A practical example: The same pressure, two different businesses 🥫
Suppose packaging costs rise. A differentiated brand with loyal customers may negotiate higher selling prices while preserving volume. A supplier of an interchangeable product facing ten rivals may have little room to do so. The same upstream shock can therefore create different margin outcomes. Exposure and bargaining power matter more than the aggregate alone.
Pricing power means changing prices while retaining sufficient demand. It is not unlimited permission to raise them or a permanent badge awarded to management. Differentiation, quality, switching costs and competitive alternatives support or weaken it. Test whether customers actually stay rather than accepting a price-increase announcement as proof.
Why does this matter to you as an investor? 📈
Because PPI lets you examine pressures before they reach the consumer—if they reach the consumer. It raises useful questions about margins, inventories, contracts and financing. It also informs the inflation discussion central banks follow. But policymakers don’t decide from one number, and industries don’t all experience the same transmission.
Treat it as an alarm prompting you to inspect the building, not a stopwatch for buying and selling. A long-term portfolio needs resilient businesses and reasonable expectations, not perfect monthly data forecasts. The indicator’s value lies in understanding where pressure might travel—and all the detours along the way.
For further reading: INE: industrial producer-price methodology (IPRI) · BLS: Producer Price Index.