
Inflation: Consumer Price Index (CPI) vs. core inflation
Inflation is down? So why isn’t my grocery bill?
CPI and core inflation: The cost of your basket isn’t the same as how fast it gets more expensive.
Let’s be honest: hearing that “inflation is easing” while coming home from the supermarket with fewer bags for the same money can feel like somebody is having a laugh. Yet both things can be true. Slowing down isn’t the same as driving backward. A grocery bill that rises more slowly is still rising.
Today I want to talk about inflation: a broad increase in the price level over time. Not one expensive shop on a Saturday, or a sudden jump in cherry prices alone. If your money buys less of a broad basket of goods and services, it has lost purchasing power. That ability to buy things is what matters—not how many zeros appear on your banking screen.
Price levels, speed and reverse gear: Three different things 🚗
Take an invented basket costing €100, then €110, then €112.20. Its price first rises 10%, then 2%. Inflation has fallen, but the basket has not become cheaper. Slower price growth is disinflation. Deflation, explored in lesson 3.4, is a broad, persistent decline in prices. Slowing down is not reversing.
A salary rising from €1,500 to €1,530 increases 2% in nominal terms. If the prices relevant to you rise faster, its purchasing power falls. Real pay compares the change in wages with the price index through a ratio. Subtracting inflation from wage growth is a useful approximation for small changes, not the exact calculation in every case.
Inflation does not require every price to rise together or by the same amount. Electronics can get cheaper while rents and food become more expensive. The aggregate movement matters. An initially isolated increase can also spread through production costs and contracts, so its wider effects deserve attention without treating one expensive product as the whole index.
CPI: A statistical shopping basket, not your personal one 🛒
Spain’s Consumer Price Index, CPI, is produced by INE, the National Statistics Institute. An index turns many observed prices into a measure of change over time. A reference level of 100 is a comparison scale, not a claim that the shopping basket literally costs €100. Index points and euros are different units.
The basket represents covered household consumption: food, relevant housing expenses, transport, recreation, communications and much more. Statisticians collect prices for comparable products across outlets and channels. The objective is to measure price changes, not mistake buying a different quantity or a better-quality item for pure inflation. Keeping comparisons consistent requires methodological work. Unlike a sentiment survey, this collects observed prices, not just impressions of how expensive life feels.
Weights reflect each category’s importance in expenditure, not how many separate products it contains. Food usually matters more than umbrellas because people spend more on it. Spain’s weighting framework draws on national accounts and supporting expenditure information. Weights are updated as consumption changes; the index is not a shopping list frozen permanently in the past. Supporting sources include Spain’s Household Budget Survey, which records household expenditure patterns.
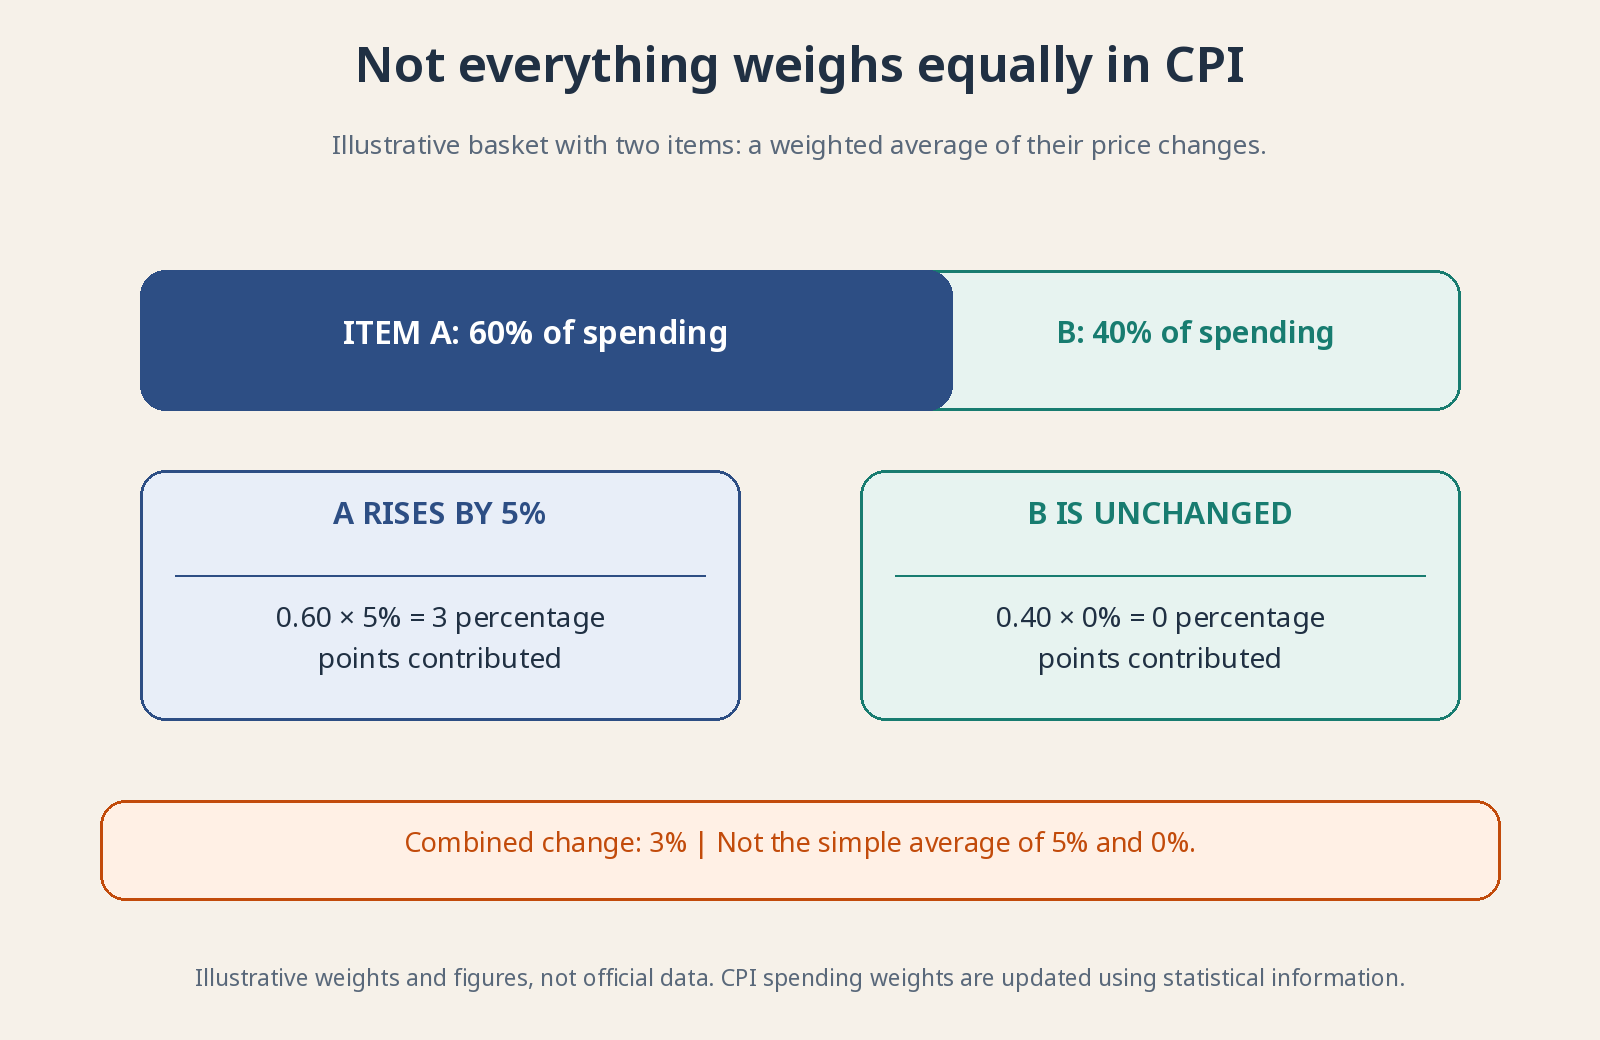
In a simplified example, 60% of spending goes to a component rising 5%, while the other 40% has no price change. The weighted increase is about 3%, not the simple average of 5% and zero. These are teaching numbers, not official weights. A large or volatile component can dominate a reading because of its expenditure weight.
Your personal spending weights can differ, so your experienced inflation may differ too.
Your inflation can differ without the statistics office lying 🧾
A daily driver notices fuel differently from a renter working at home. A national average cannot reproduce both budgets exactly. Frequent purchases also loom larger in memory, and painful price increases may be easier to remember than reductions. A gap between your experience and the index is not, by itself, evidence that somebody fabricated the statistics.
CPI does not measure total wealth or every asset price. Purchasing a home is acquiring an asset, not the same transaction as paying rent for housing services. House-purchase prices do not simply enter the consumer basket like potatoes. Housing coverage and owner-occupied housing treatment depend on the specific index, so read the methodology before drawing comparisons. Use separate housing indicators to investigate affordability rather than asking CPI alone to describe the whole problem.
Nor does CPI measure every household’s complete financial squeeze, including all tax changes, needs and personal circumstances. It tracks covered consumption prices. Your budget is the right tool for understanding your own bills; a common statistical measure helps compare price movements across time and populations. Neither can do every job the other does.
Monthly, annual and base effects: Watch the rearview mirror 📆
Monthly inflation compares prices with the previous month; year-on-year inflation compares with the same month a year earlier. They are not interchangeable. Small repeated monthly increases can accumulate, while the annual rate can change because of movements eleven or twelve months back. Always identify the comparison window before interpreting the headline.
A base effect comes from the starting point of the comparison. If energy jumped unusually sharply a year ago, its departure from the annual comparison can reduce measured inflation even without a current price fall. This isn’t a special statistical trick. Comparing any growth rate with an unusually high or low starting value changes the result.
Sales, holidays and other calendar patterns recur. Analysts therefore examine seasonally adjusted series where available and trends over several months. Adjustment tries to distinguish recurring patterns from new movements; it doesn’t erase uncertainty. One monthly reading can be noisy even when correctly measured, and a smooth-looking series is still an estimate.
Core inflation: Filtering out noise doesn’t cancel your bills 🔍
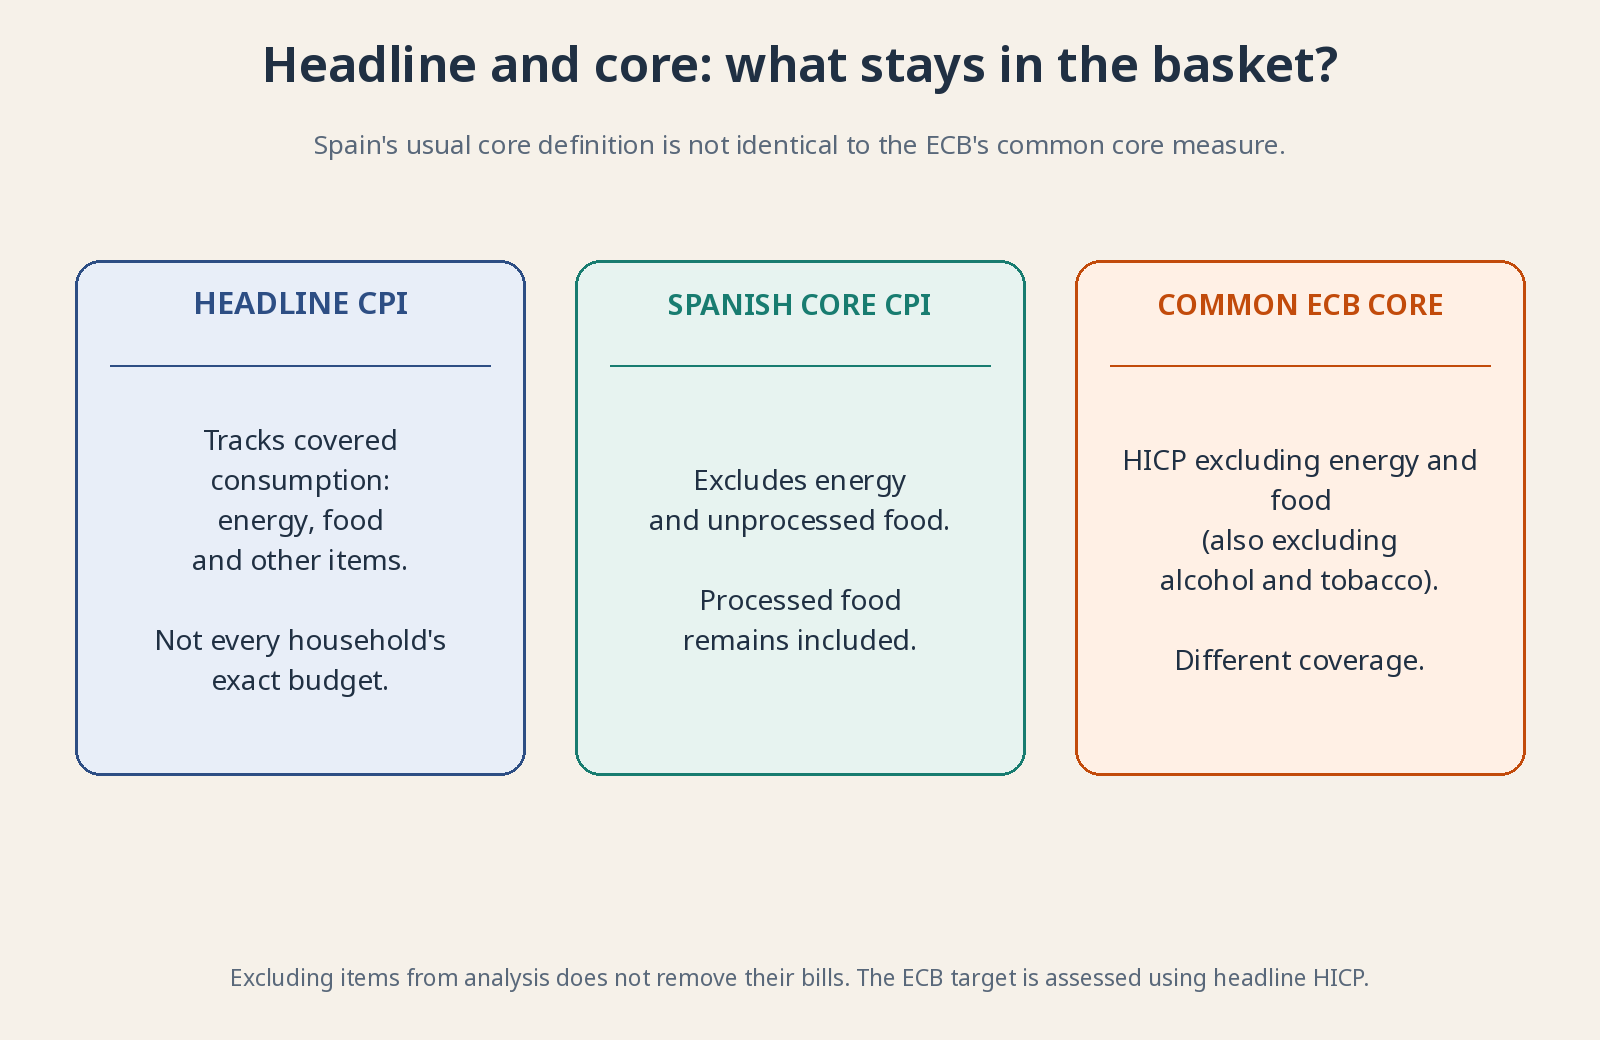
Core inflation filters selected volatile components to help assess more persistent pressure. Spain’s usual national core CPI measure excludes energy products and unprocessed food. It does not exclude every kind of food. The exclusions define a particular analytical measure, not a verdict that those bills are unimportant.
Nobody is suggesting you stop eating or using electricity. Headline CPI still includes covered purchases in those categories. Comparing headline and core helps distinguish, for example, an oil-price jump from widespread service inflation. Either can matter to households, but their persistence and policy implications may differ. You need the diagnosis as well as the total. Excluded costs can still affect included prices indirectly: a restaurant needs energy to cook even when energy itself is removed from a core measure.
Core measures are not identical everywhere. A common ECB measure excludes energy, food, alcohol and tobacco from HICP. That differs from Spain’s national core definition. Never compare two series merely because both are labeled core; check exactly what each leaves out.
Always check the series definition. “Core” is not a universally identical basket.
Harmonized inflation: Common rules for comparing countries 🇪🇺
The Harmonised Index of Consumer Prices, HICP, applies common European measurement rules. It does not require every country to buy the same basket or use identical weights. National CPI and HICP can differ in coverage and methodology. Harmonization makes comparisons more consistent without pretending that household spending patterns are the same across Europe.
The ECB assesses its inflation objective using euro-area HICP, not just Spain’s CPI or one core measure. A shared monetary stance can feel uncomfortable in a country experiencing a different cycle from the average. The currency is common; energy dependence, housing arrangements and household budgets are not identical.
Demand, costs and structural pressures: What’s driving inflation? 🔥
Saying inflation is running hot is informal language, not an official statistical category. It usually suggests strong demand and price pressure. When households and businesses want to spend more than producers can readily supply, sellers may gain room to raise prices. Demand-driven inflation describes that mechanism, not a complete explanation for every increase.
An adverse supply shock makes production harder or more expensive: scarce energy, poor harvests or disrupted transport. It can raise prices while weakening activity. Structural pressures, such as persistent bottlenecks or capacity constraints, last longer. Distinguishing demand from supply helps explain why similar inflation readings can require different interpretations.
Expectations influence wage negotiations, contracts and pricing. People anticipating continued increases may try to protect themselves in advance, potentially making inflation more persistent. But not every wage rise creates a self-sustaining wage–price spiral. Productivity, margins, competition and the broader policy response affect how an initial shock develops.
The ECB’s 2%: A target, not a law of nature 🎯
The ECB targets 2% inflation over the medium term, symmetrically: persistent deviations above and below are undesirable. This does not promise every price rising 2%, an exact outcome each month or an immediate return to yesterday’s shopping bill. The medium-term horizon allows for shocks and the delays through which policy operates.
Low positive inflation provides some buffer against deflation and can ease relative wage and price adjustments. That doesn’t make lost purchasing power pleasant. It is a monetary-strategy choice within an institutional mandate, not a law of nature. Returning inflation to target can also carry costs when policy restrains spending and employment, as module 4 explains.
Why does this matter to you as an investor? 📈
Because keeping euros doesn’t guarantee keeping purchasing power. A positive nominal return can still fall short of inflation and taxes. Recognizing that risk doesn’t mean every investment protects against it, especially over every time horizon. Businesses also suffer when rising costs can’t be passed to customers.
Look at what is rising, how broadly and for how long. Can a company retain customers after raising prices, or does it only appear to grow because everything costs more? Don’t mistake one decimal point in CPI for a portfolio instruction. Understanding inflation improves your reading of the environment. Predicting every release is another occupation—and a fairly thankless one.
For further reading: INE: CPI methodology · INE: core inflation and special aggregates · ECB: core inflation measures · ECB: monetary policy strategy and inflation target.