
3.1 Gross Domestic Product (GDP) and Purchasing Power Parity (PPP)
Is the country richer—or have prices just gone up?
GDP and PPP: Measuring the pie, separating out prices and not confusing size with distribution.
Let’s be honest: “GDP has grown” looks wonderful in a press conference, but it doesn’t tell you whether making ends meet has become easier. There may be more output, more people, higher prices or some combination of all three. Before celebrating the headline, look inside the number. Putting a tie on a thermometer doesn’t improve the temperature.
Today I want to talk about gross domestic product (GDP) and purchasing power parity (PPP). The first summarizes what an economy produces; the second helps compare economies where an equivalent basket costs different amounts. They aren’t investment products or two ways of measuring your current-account balance. They are statistical tools: useful maps with boundaries and blind spots.
GDP: Output over a period, not money in a box 📦
GDP measures the value of final goods and services produced within a territory over a period, usually a quarter or year. “Domestic” refers to where production takes place, not the owner’s passport. A foreign-owned factory in Spain contributes to Spanish GDP. A Spanish company’s factory abroad does not contribute merely because its parent is Spanish. Other measures track residents’ income; GDP needn’t do every job.
“Final” avoids double counting. Imagine a farmer selling wheat for €1, a mill selling the resulting flour for €2 and a baker selling the bread for €3. Final output is €3, not €6. The production approach reaches the same answer by adding value added: each stage’s output minus its intermediate purchases. In this simplified chain each stage adds €1.
“Gross” means consumption of fixed capital has not been deducted: the wear and loss of economic service of machinery, buildings and other productive assets. Not all output adds to wealth; some replaces what wears out. Deduct that consumption and net domestic product is a different measure.
“Over a period” matters too. GDP is a flow, like annual income. Accumulated wealth is a stock measured at a date, like the assets you own today. A country can produce plenty while heavily indebted, or possess great wealth while producing little in a particular year. GDP is neither the speed at which each euro changes hands nor Treasury revenue. It measures output.
Modern national accounts developed as governments needed an economy-wide view, especially during twentieth-century crises and wars. Spain’s INE, the National Statistics Institute, compiles them under shared international rules. Common rules support comparison, not impossible precision. Surveys, estimates and revisions remain part of the process.
Three cameras filming the same movie 🎥
The production approach sums value added, then adds taxes on products minus subsidies to reach market prices. That adjustment reconciles production values with prices paid. It looks at what factories, shops, hospitals and offices generate without counting intermediate ingredients repeatedly.
The expenditure approach asks who buys final output. The income approach examines income generated by production: employee compensation, businesses’ operating surplus, self-employed mixed income and relevant tax and subsidy adjustments. Operating surplus is a national-accounts category, not simply a listed company’s bottom-line net profit.
These are three views of the same activity, not three economies to add together. They agree in principle. In practice, data arrive at different times and statisticians reconcile sources. Recognizing estimation uncertainty is more serious than pretending someone counted every coffee sold in the country.
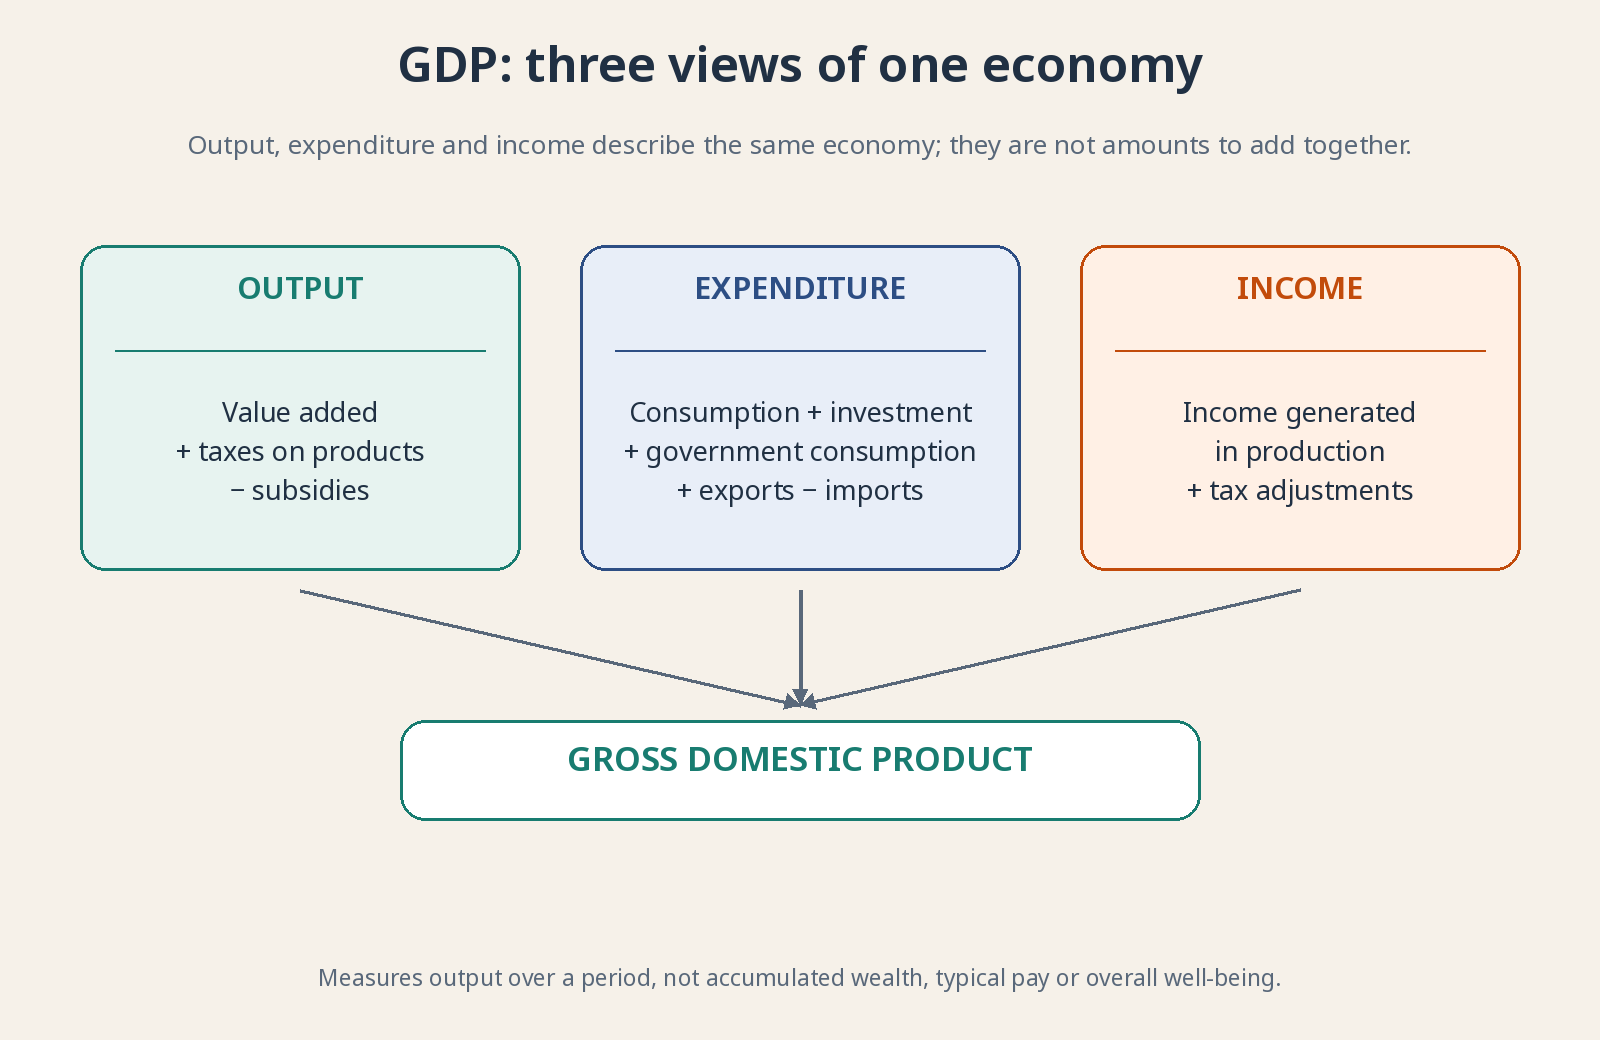
Conceptual national-accounts framework. Measurement differences can produce statistical discrepancies.
The formula without the mystique: C + I + G + (X − M) 🧮
The expenditure identity is GDP = C + I + G + (X − M). An identity balances because of how its components are defined; it isn’t a recipe guaranteeing growth by changing one letter. Here C is private consumption, G government consumption and I both private and public capital formation. This convention avoids counting a public road twice.
C includes final consumption by households and nonprofit institutions serving them: food, haircuts and transport. I includes new productive capital and inventory changes: machinery, new homes, qualifying software and goods produced but not yet sold. Output doesn’t vanish from GDP just because the factory hasn’t sold everything this month.
Buying an existing share is not I: ownership of a financial asset changes. Buying an existing house doesn’t recreate the building either, although associated brokerage services can generate output. As lesson 1.2 explained, macroeconomic investment doesn’t mean exactly the same as investing in your portfolio.
G includes public services and purchases used to provide them, such as education and healthcare. Public investment belongs in I under this convention. Pensions and benefits are transfers: they redistribute income rather than purchase current production. When recipients buy food, consumption enters the accounts. Counting both the pension and that purchase as output expenditure would double count.
X is exports and M imports. Imports are subtracted because C, I and G can already contain foreign production. An imported phone enters consumption; subtracting its imported content removes what wasn’t produced domestically. Domestic distribution can still add value. This is accounting, not a declaration that importing is bad. A recession can reduce imports and improve the external balance without making the economy healthy.
Nominal vs. real: Bigger euro amounts don’t always mean more stuff 🏷️
Nominal GDP values production at the period’s prices. Real GDP, a volume measure, tries to separate quantities from prices. Produce 100 loaves at €1, then the same 100 at €1.10, and nominal value rises from €100 to €110 without one extra loaf. Real output has not increased.
Across thousands of goods, quality changes and new services, calculation needs price indices and chain-linked volume methods—not subtraction scribbled on a napkin. The GDP deflator tracks prices for the output GDP covers. CPI tracks consumer prices; the baskets and coverage differ. “Nominal GDP growth minus CPI inflation” is therefore not an exact real-growth formula.
Check the comparison period. Quarter-on-quarter compares with the previous quarter; year-on-year with the same quarter a year earlier. Seasonal adjustment tries to remove recurring patterns such as holidays, so a normal summer isn’t mistaken for a miracle. Early estimates are revised as fuller information arrives. Revision isn’t necessarily deception; it is a cost of measuring promptly.
Per capita: Dividing with a calculator doesn’t redistribute income 👥
GDP per capita divides output by population, separating total size from output per person. A populous country can have a huge economy and a modest per-person figure. If real output grows more slowly than population, real GDP per capita can fall while total GDP rises. The headline and your experience can describe different parts of the picture.
An average isn’t a typical salary or an amount each resident receives. Very high incomes at the top can lift an average without most people feeling richer. GDP doesn’t directly subtract pollution, depleted resources, insecurity or lost leisure. Much unpaid domestic work is excluded. Some housing services are estimated using imputed rents—the service owner-occupied housing would provide if rented. The accounting boundary does not mean “everything valuable.”
A disaster can destroy wealth and then generate rebuilding activity. The rebuilding adding to GDP doesn’t make the disaster good news. Studying well-being also requires distribution, health, education, public services and environmental measures. GDP contributes one piece. It doesn’t issue happiness certificates.
PPP: Comparing baskets, not just exchange rates 💱
Take two invented countries. An equivalent basket costs 100 units in A and 200 in B: the basket-price ratio is two B per A. If the market exchanges one A for four B, converting output at that exchange rate produces a different comparison from local purchasing power. Financial flows and expectations also move exchange rates—not just meal or haircut prices.
PPP constructs conversion factors by comparing similarly specified goods and services, using expenditure weights. Not one burger or one tourist’s personal basket. The World Bank-coordinated International Comparison Program, OECD—the Organisation for Economic Co-operation and Development—and Eurostat organize such comparisons. Comparing public services and housing is much harder than weighing a kilogram of rice.
If the factor is local currency per international dollar, divide local-currency GDP by that factor. The international dollar is a statistical unit representing purchasing power equivalent to a US dollar in the United States for the compared aggregate. It isn’t a special banknote available at an ATM, and it cannot pay an import invoice.
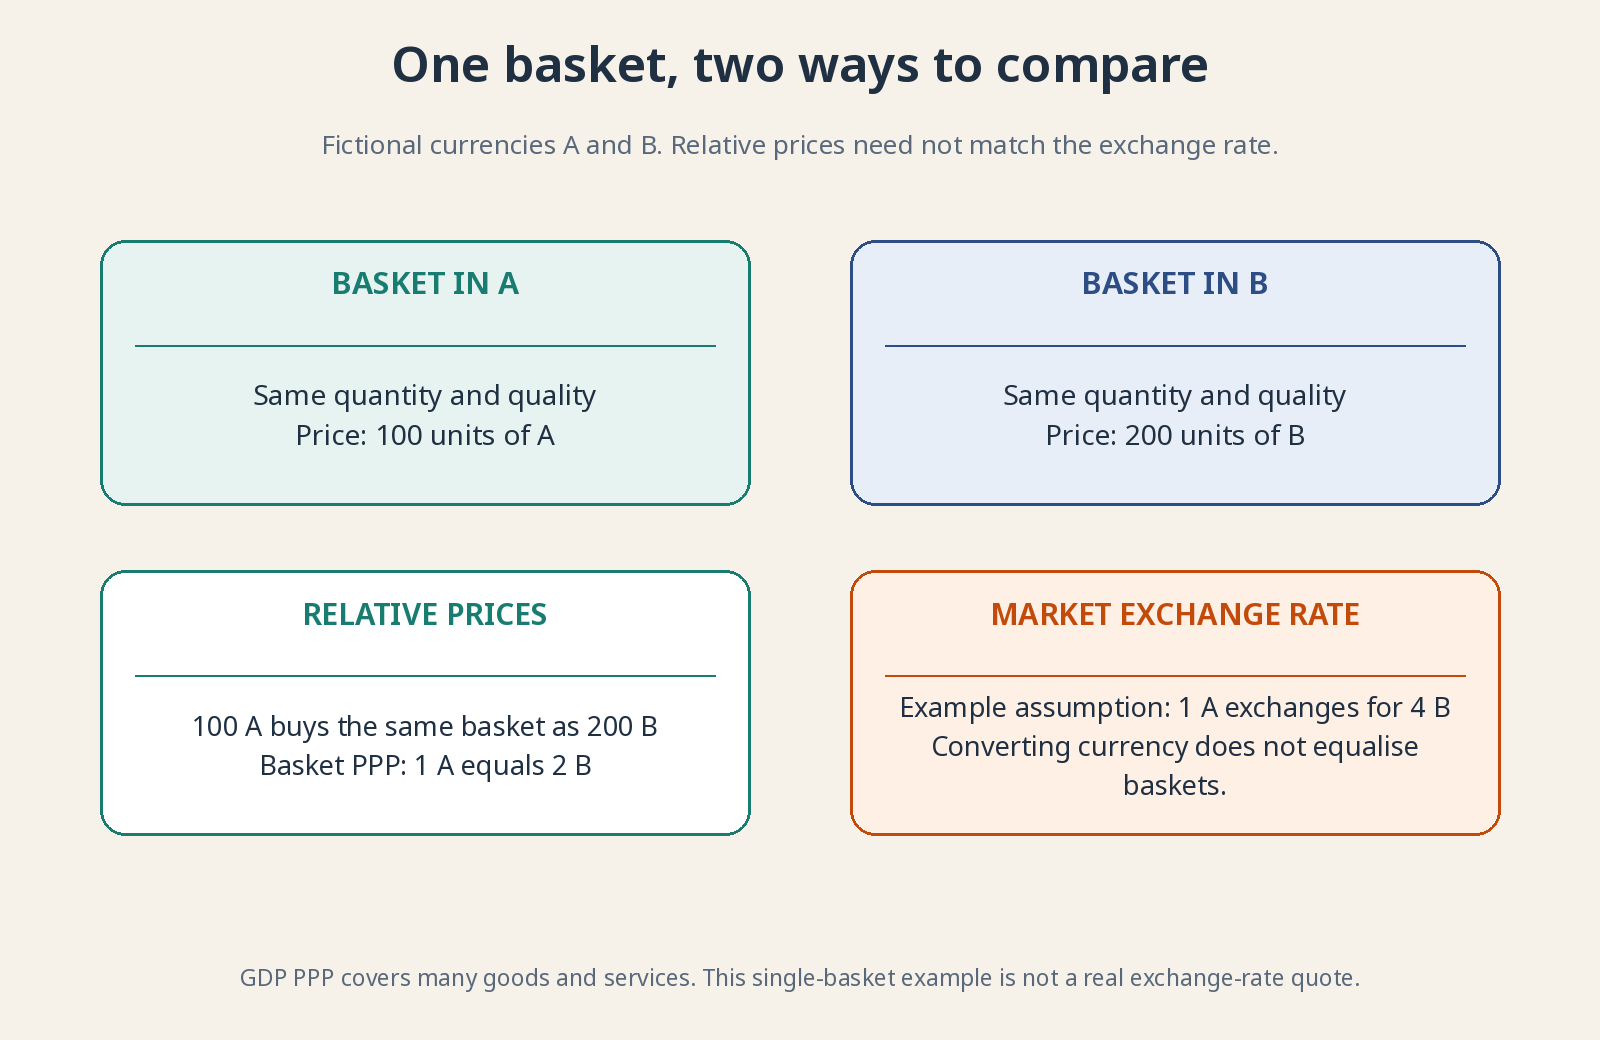
PPP compares purchasing power; market exchange rates convert financial payments. Neither replaces the other.
Why the rankings change—and what that doesn’t tell you 🗺️
Local services are often cheaper in lower-income economies. Valuing their volumes at comparable prices can increase their relative weight. Rankings at market exchange rates and PPP can therefore order China and the US differently. For a dated example, the World Bank’s 2021 comparison placed China ahead in total PPP GDP. That does not mean the average Chinese resident had higher income than the average US resident.
PPP is useful for comparing local production and purchasing power. For dollar-invoiced oil, foreign debt repayments or converting a dividend to euros, the actual market exchange rate matters. The gap between market conversion and PPP isn’t an automatic undervalued-currency signal or a promise of market correction. Local costs, trade barriers and productivity can sustain differences for a long time.
Why does this matter to you as an investor? 📈
Because “fast-growing country” and “good investment at my purchase price” aren’t synonyms. A company may grow more slowly than its home economy, dilute shareholders or sell mostly overseas. Competition, costs, taxes and financing affect profits too. GDP describes the pitch; it doesn’t hand you the match result.
Before using a number, ask: nominal or real? Total or per capita? Market exchange rates or PPP? Which period and which revision? Simple questions prevent enormous mistakes. They help you keep a long-term perspective without treating every quarterly release as an excuse to jump in and out of stocks.
For further reading: INE: Glossary of National Accounts · World Bank: Concepts of PPP · World Bank: Results and limitations of the ICP.