
📊 𝗣𝗼𝗿𝘁𝗳𝗼𝗹𝗶𝗼 𝗖𝗼𝗻𝘀𝘁𝗿𝘂𝗰𝘁𝗶𝗼𝗻 𝗮𝗻𝗱 𝗥𝗶𝘀𝗸 𝗠𝗮𝗻𝗮𝗴𝗲𝗺𝗲𝗻𝘁
1/2 Knowing how to select good companies is only half the job.
1/2 The other half —and the one that usually determines whether you sleep soundly at night— is how you combine those stocks into a portfolio.
🎯 In this lesson, we will cover everything from the theoretical foundations developed in the 1960s and 1970s to the most widely used practical asset allocation models by professional investors. No incomprehensible formulas, no unnecessary fluff: straight to the point.
1. Modern Portfolio Theory (1960s-1970s) 🏛️
Before the 1950s and 1960s, people invested by analyzing each asset in isolation. If a company looked good, it was bought; if it looked bad, it was discarded.
It was Harry Markowitz (who later won the Nobel Prize for this) who changed the game with Modern Portfolio Theory (MPT). His key insight was simple: an asset's risk shouldn't be evaluated in isolation, but by how it impacts the risk of the overall portfolio.
-
The Efficient Frontier: The curve representing portfolios that offer the maximum expected return for a given level of risk. Any combination below this line is inefficient (you are taking on more volatility than necessary for the return you get).
2. Diversification: The Only "Free Lunch" in Finance 🧺
On Wall Street, it is often said that diversification is the only free lunch you will ever find.
If you buy two companies that behave differently in response to the same economic events, you reduce the total volatility of your portfolio without necessarily sacrificing expected returns.
-
The Real Goal: It's not about buying dozens of assets at random, but about combining assets whose fluctuations don't coincide in time.
3."Diworsification": When Diversification Destroys Value ⚠️
The legendary investor Peter Lynch coined the term Diworsification to warn against a very common mistake.
It occurs when an investor —or a corporate executive— buys mediocre assets or businesses they don't fully understand, driven solely by the obsession to "be diversified."
-
The Problem: Adding 50 or 100 companies to your portfolio just to fill space doesn't reduce your real risk any further; it only dilutes the impact of your best investment ideas and turns your portfolio into an expensive, poorly managed index fund. 📉
4. Systematic Models
There are models designed so you don't have to predict the economic future. The two most famous are:
4.1. Permanent Portfolio (Harry Browne)
Designed in the 1970s to weather the four possible economic scenarios:
| Economic Scenario | Benefited Asset | Allocation |
| Prosperity | Equities (Stocks) | 25% |
| Inflation | Gold | 25% |
| Deflation | Long-Term Bonds | 25% |
| Recession | Cash / Short-Term Bonds | 25% |
4.2. "All Weather" Portfolio (Ray Dalio) 🌦️
Unlike Browne, Ray Dalio (founder of Bridgewater) doesn't split capital equally; he balances risk (Risk Parity). Since stocks are more volatile than bonds, the standard allocation is adjusted as follows:
-
📊 30% Global Stocks (growth)
-
📜 40% Long-Term Treasury Bonds (defense/deflation)
-
📜 15% Intermediate-Term Treasury Bonds (stability)
-
🥇 7.5% Gold (monetary protection)
-
🛢️ 7.5% Commodities (inflation)
5. Core-Satellite Strategy 🛰️
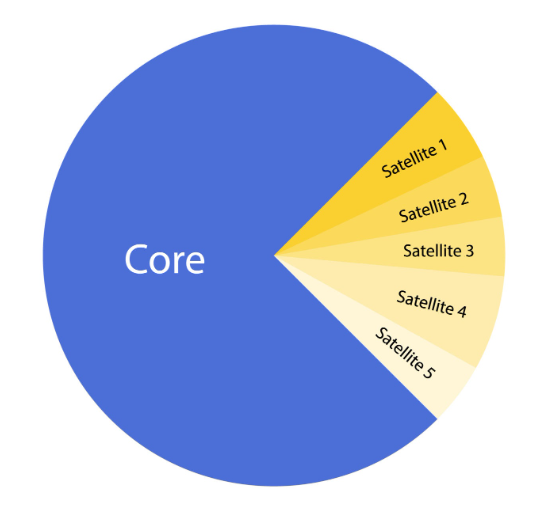
This is one of the most practical structures for individual investors looking to combine the peace of mind of passive management with the potential of stock picking.
-
🏢 The Core (60% to 80%): Made up of global index funds or low-cost ETFs (e.g., MSCI World or S&P 500). It's the boring baseline that guarantees long-term returns tied to the market.
-
🚀 The Satellites (20% to 40%): Made up of high-conviction individual stocks (compounders, value stocks, growth companies) or specific sectors where you seek to generate alpha (outperform the index).
6. The Classic 60/40 Portfolio ⚖️
It has been the institutional benchmark for decades.
-
60% Equities: Provides the growth engine.
-
40% Fixed Income: Acts as a buffer during stock market downturns and provides coupon income.
Does it work today? It works well when stocks fall and bonds rise (negative correlation). However, in environments of high inflation and aggressive interest rate hikes (like 2022), both stocks and bonds can fall simultaneously, exposing the limitations of this strategy if additional protection (such as gold or commodities) isn't included.
7. Joel Greenblatt: Market Risk vs. Specific Risk 🎯
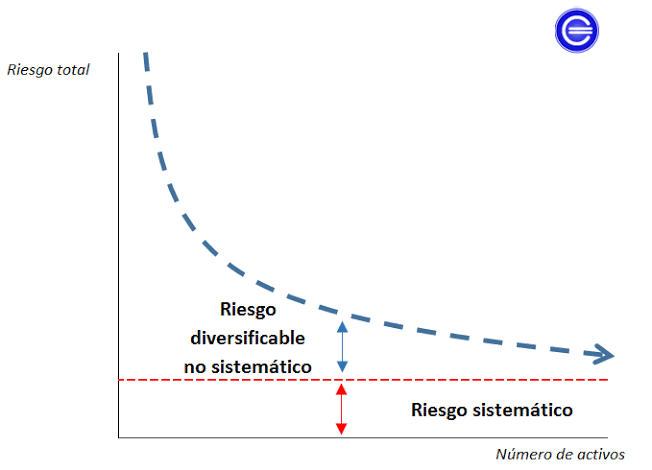
Famous investor Joel Greenblatt (author of The Little Book That Still Beats the Market) clearly explains the two types of risk that exist:
-
Specific Risk (Unsystematic): The risk inherent to a specific company (a bad earnings report, product issues, CEO resignation). This risk is eliminated through diversification.
-
Market Risk (Systematic): Macroeconomic risk affecting the entire system (wars, recessions, interest rate hikes). This risk CANNOT be eliminated by diversifying stocks.
Greenblatt's Rule: Holding between 20 and 30 well-selected stocks across different sectors eliminates between 90% and 95% of specific risk. Going from 30 to 500 stocks barely reduces any additional risk, but it destroys your ability to deeply analyze what you own.
8. Asset Correlation and Portfolio Beta 📐
To mathematically measure how assets in your portfolio interact, you use two essential metrics:
8.1. Correlation
Measures the degree to which two assets move in the same direction. Its value ranges between -1 and +1:
-
+1 (Perfect correlation): Move in exact lockstep. If A rises 5%, B rises 5%. Offers no diversification.
-
0 (No correlation): A's movement tells you nothing about B.
-
-1 (Inverse correlation): If A falls, B rises. Ideal for hedging sharp downturns.
8.2. Portfolio Beta
Beta measures the sensitivity or volatility of an asset relative to its benchmark index ($\beta = 1.0$).
-
$\beta > 1.0$: More volatile than the market (e.g., a beta of 1.3 will rise or fall 13% when the market moves 10%).
-
$\beta < 1.0$: More defensive than the market.
The Portfolio Beta is simply the weighted average of the betas of each individual asset.