
7.2 Tracking global liquidity from major central banks
Is there really a tap that decides how far stocks will rise?
Tracking liquidity means checking more pipes—and trusting fewer miracle charts...
Let’s be honest: a line labeled “global liquidity” laid over a stock-market chart can look like the answer to years of study. When it rises, everything is explained. When it doesn’t fit, shift it a few weeks until it looks brilliant again. Before admiring the picture, ask what the line adds together, in which currencies, and why it should predict the future. Drawing a green arrow on a pipe doesn’t explain the plumbing.
Today I want to discuss tracking major central banks’ liquidity conditions without inventing an all-knowing indicator. The Federal Reserve, the Eurosystem, the Bank of Japan and other authorities’ balance sheets matter. So do private financing and the ease of trading assets. These dimensions are related, not interchangeable. The goal is to understand vulnerabilities—not discover a secret button for entering the stock market.
Three meanings of liquidity you shouldn’t mix up 🚰
Central-bank liquidity here means central-bank money used by banks, especially reserves held in their accounts at the central bank. As lesson 2.2 explains, these are not your banknotes stored separately or balances lent directly to households. They are part of the settlement and monetary-policy machinery. Start with the right kind of money before following the arrows.
Funding liquidity is the ability to obtain financing or roll obligations at manageable cost and maturity. A company can own a valuable factory and still lack tomorrow’s payment money. Market liquidity is the ability to trade an asset quickly, at reasonable cost and without excessive price impact. A cash deadline and an asset sale are connected but distinct problems.
The channels interact. Harder asset sales can prompt tougher collateral terms; expensive funding can reduce traders’ participation and market depth. Aggregate reserves can be ample while a particular market remains blocked. Plenty of water in the reservoir does not guarantee it reaches every tap. Distribution and access matter alongside the total.
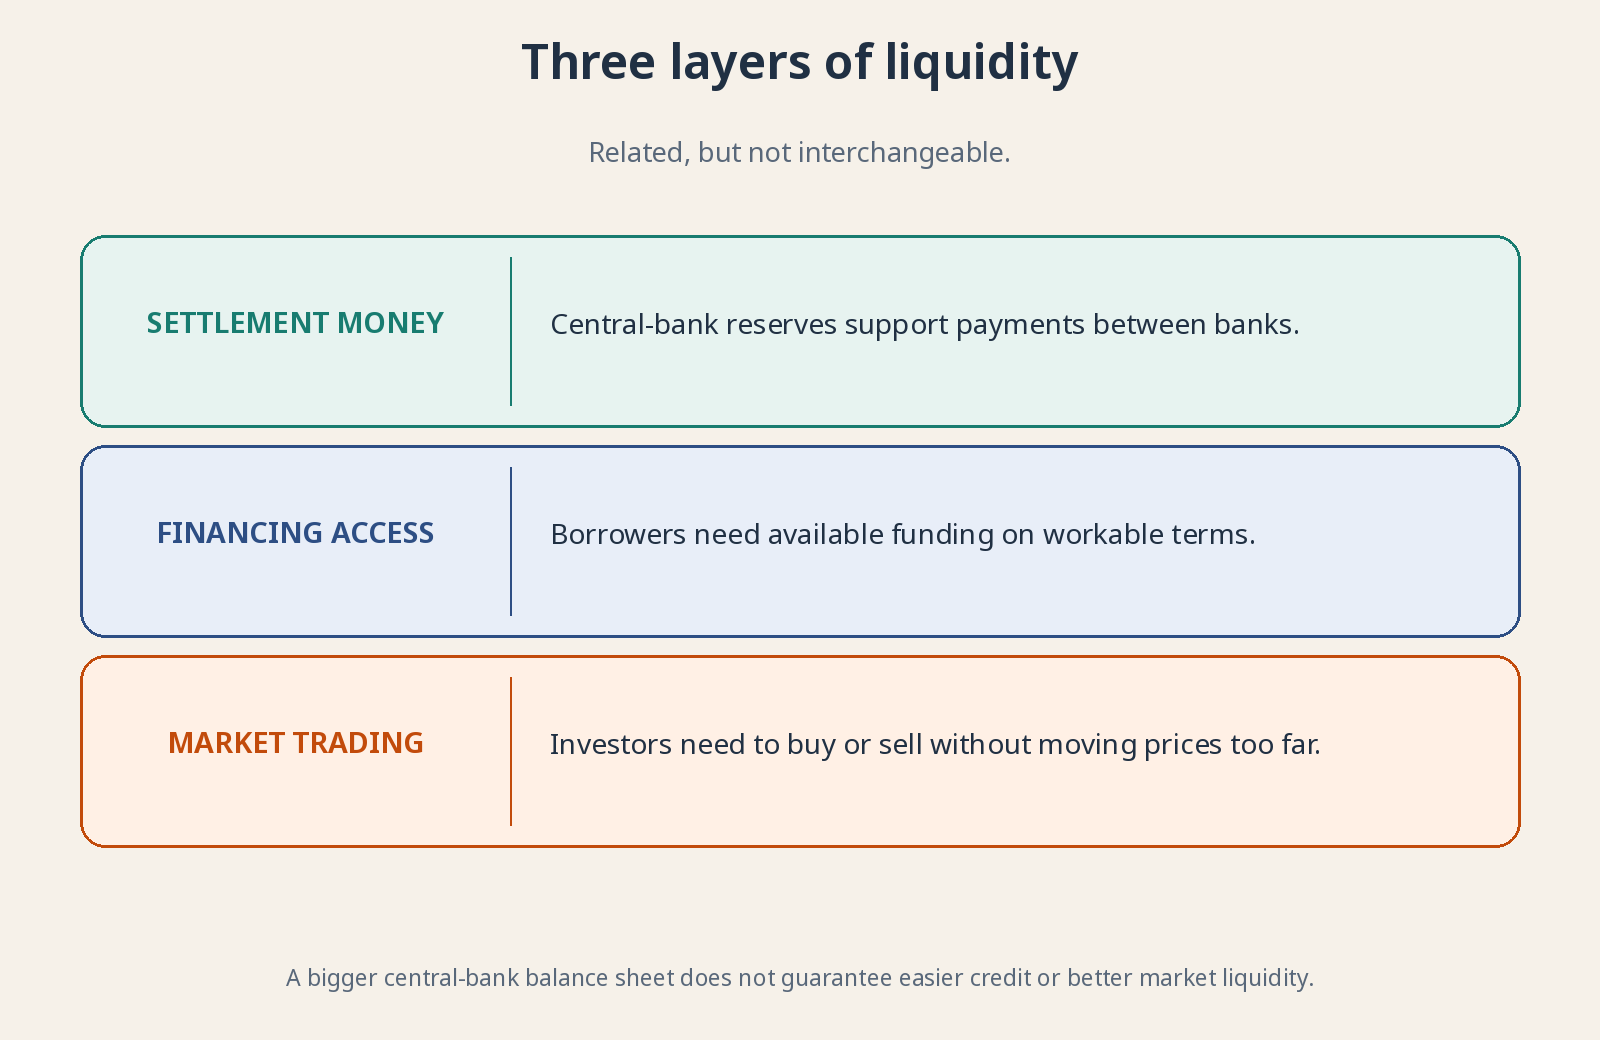
A bigger central-bank balance sheet does not guarantee easier credit or better market liquidity.
What a balance sheet tells you—and what it doesn’t 📒
A balance sheet shows assets, liabilities and equity at a point in time. Central-bank assets can include securities and loans to banks; liabilities include currency, reserves and other deposits. Asset purchases and lending change particular entries. A larger total alone does not tell you which transaction occurred or who obtained usable funding.
Track level, change and composition. Level shows the accumulated stock; change shows movement over a specified period; composition identifies the entries driving it. A large balance sheet that stops growing differs from a small one expanding quickly. Don’t confuse the height of a line with its slope—or either with a complete forecast for shares.
Net purchases, reinvestment and loan repayments produce different paths. Reinvestment uses proceeds from maturing holdings to acquire replacements; full reinvestment can keep a portfolio broadly stable without net expansion. Net means after offsetting purchases and reductions within the stated measure. Lesson 7.3 examines the practical balance-sheet reading; here we’re building the monitoring map.
The Fed: Read beyond the headline number 🇺🇸
The Fed publishes H.4.1, covering assets, liabilities and factors affecting reserve balances. Its name looks like a filing code because it is one, not because it is secret knowledge. Inspect Treasury securities, mortgage-backed securities, loans and other assets, alongside bank reserves, currency and other deposits. You need the important changes, not a ritual copying of every row.
The Treasury’s account at the Fed and reverse repos also matter. Treasury receipts transferred from commercial-bank deposits can reduce bank reserves; spending can add them back, other things equal. Fed reverse repos let eligible counterparties temporarily place cash with it against securities. Shifts among liabilities can change reserve balances without any new outright bond purchase.
That is why a formula subtracting selected liabilities from total assets can describe some periods and mislead in others. It does not capture every funding channel or the distribution of reserves. If you see a net liquidity chart, ask for its formula, data and limitations. A persuasive label does not turn subtraction into a universal monetary law.
Your first row, already checked ✍️ You don’t need a dashboard to start: one well-labelled row is enough. This one comes from the WALCL series on FRED, the St. Louis Fed’s public database, which carries total assets from table 5 of the H.4.1 (the consolidated balance sheet of all Federal Reserve Banks):
| Balance date | Series | Value | Unit | Frequency | Published in |
|---|---|---|---|---|---|
| Nov 4, 2026 (Wednesday) | Fed total assets (WALCL) | 6,748,145 | Millions of US dollars (about $6.75 trillion) | Weekly, Wednesday level | H.4.1 of Nov 5, 2026 |
How to read it: on the previous Wednesday, October 28, the total was $6,745,635 million, so it rose about $2.5 billion, roughly 0.04%—essentially flat. Compared with a year earlier, the same release shows about $175 billion more (close to 2.7%). Now the important part, what this row doesn’t let you conclude: it doesn’t tell you which item moved the total or whether there were net bond purchases (that takes the composition, which you’ll work through in lesson 7.3); it doesn’t tell you how many reserves banks hold, since those sit on the liability side and can move with the Treasury’s account or reverse repos even when assets don’t change; it says nothing about the Eurosystem or the Bank of Japan; and it isn’t a signal to buy or sell shares next week. It’s a dated snapshot: the next one arrives with the H.4.1 of November 12. When you copy your own rows, always record both dates, the balance date and the publication date.
Source: FRED, WALCL series, observation for November 4, 2026, checked against table 5 of the H.4.1 of November 5, 2026. Accessed November 8, 2026.
The Eurosystem: Look beyond the building in Frankfurt 🇪🇺
The Eurosystem includes the ECB and the national central banks of euro-area countries. Its consolidated balance sheet brings them together while eliminating internal positions that would otherwise be counted twice. Looking only at the ECB legal entity is not equivalent to looking at the whole system. The building in Frankfurt is not the entire balance sheet.
Weekly financial statements separate securities portfolios, lending to banks and different liabilities. Repayment of central-bank loans can shrink assets without a single outright bond sale. Securities maturing without full reinvestment produce another route to contraction. Identify the entry responsible before describing every decline as the same kind of tightening operation. A higher valuation of gold holdings can instead lift total assets without an equivalent new financing operation.
Add monetary and credit statistics and bank-lending surveys. Lower reserves alone do not show whether creditworthy businesses can still borrow. Surveys report changes in standards, terms and demand rather than measuring the whole loan stock directly. Comparing quantities, prices and reported conditions helps distinguish plumbing changes from a real credit squeeze.
Japan and other central banks: Same labels, different systems 🌏
The Bank of Japan publishes its accounts too, but its financial structure, tools and historical holdings are not copies of the Fed’s. For the Bank of England, China’s central bank or another authority, begin with official publications and its operating framework. Similar institution names do not guarantee identical assets or cross-border transmission.
Publication calendars differ. One authority may report weekly, another at a different frequency, and publication dates need not match observation dates. A supposed coordinated turn can partly reflect mismatched timing. Put reference dates next to the numbers before drawing a line through them. Otherwise the comparison mixes different snapshots while pretending they were simultaneous.
The trap of adding euros, yen and dollars 🧮
To add balance sheets you must choose a common currency. Yen appreciation increases the dollar value of an unchanged yen balance sheet. A global line can therefore show an apparent injection caused by currency conversion rather than a new transaction. Check local-currency changes as well as the translated total before attributing the move to policy. State whether your combined series uses current or constant exchange rates; that construction choice changes the interpretation.
Revaluations change recorded values through prices or exchange rates, unlike new transactions. A sum of assets is not automatically a measure of available reserves, private credit, international funding or willingness to take risk. A global aggregate can be useful if its construction is explicit. It becomes misleading when one line is asked to represent all those different things.
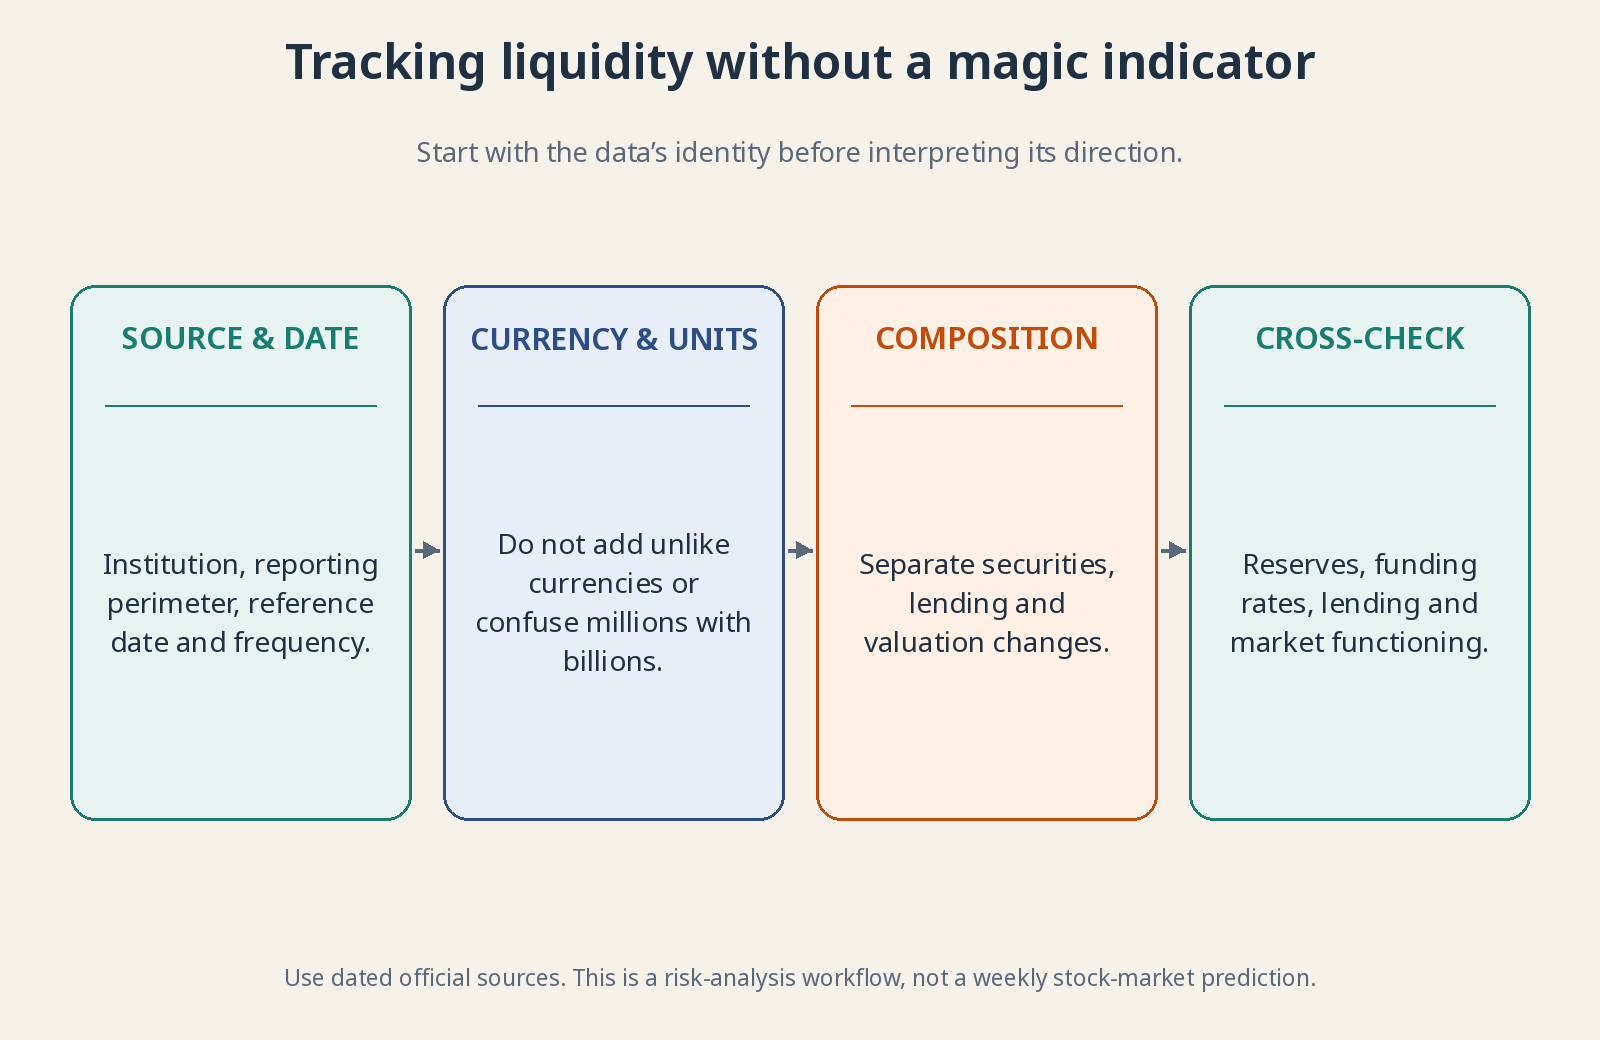
Use dated official sources. This is a risk-analysis workflow, not a weekly stock-market prediction.
Why this can affect risk premiums 🧲
Financial conditions include rates, spreads, credit access, exchange rates and asset prices, among other elements. A central-bank balance sheet can expand during extremely tight conditions because it is responding to a crisis. Correlation is not enough to identify causation. The fire engine arrives when there is a fire; that does not mean it started one.
What else to watch without building a control room 🔍
Watch short-term funding costs against relevant policy and secured-market references, access to operations and credit spreads. In markets, inspect bid–ask spreads, volume and depth. One quiet headline number can coexist with stress in a specific segment. You need a small set of complementary gauges, not a control room full of charts you cannot explain.
The BIS uses global liquidity to describe ease of financing in international markets. Its indicators track credit to nonbank borrowers through loans and bonds, particularly foreign-currency financing in dollars, euros and yen outside their home areas. This is a defined public data framework, not a weekly sum of four central-bank balance sheets or an official stock-market timing signal.
BIS statistics arrive with a lag and can be revised. They help identify foreign-currency dependence and international credit trends, not tomorrow’s opening price. Combine slower structural sources with more timely market measures while remembering what each covers. The objective is understanding financing vulnerability, not assembling a dashboard that promises to remove investment uncertainty.
Why does this matter to you as an investor? 📈
Because fragile companies can look resilient while refinancing is easy. When access changes, maturities, collateral and debt weigh more heavily. Use monitoring to stress-test the portfolio: which businesses need continuously open markets, and which exposures depend on nobody asking for their money simultaneously? System reserves don’t guarantee each borrower’s solvency.
A sober monitoring process fits into periodic notes: which central bank changed which item, in what currency, for what reason, and which other signals confirm or contradict it? If you can’t explain the line you’re watching, don’t hand it your decisions. Liquidity is context for judging resilience—not permission for personal leverage or a trading calendar.
For further reading: Federal Reserve: H.4.1 statistical release · ECB: Eurosystem weekly financial statements · Bank of Japan: accounts · BIS: scope and limitations of global liquidity indicators.