
5.3 The yield curve and recession prediction
Why might lending for ten years pay less than lending for three months?
The yield curve: A conversation about the future, not a crystal ball on Fed letterhead.
Let’s be honest: asking for more interest when lending for longer sounds natural. If your neighbor wants twenty euros until tomorrow, that’s one thing. If they want it for ten years, you start asking about their plans. Yet longer maturities sometimes offer lower yields than shorter ones in the bond market. When that happens, somebody usually announces the economic apocalypse before the coffee is finished.
That is a yield-curve inversion. It deserves attention because of its historical association with recessions, especially in the United States. But first we need to take it apart: what the points on the curve represent, what moves each end and why an informative warning is not an expiry date stamped on your portfolio.
Before the curve: Debt and its yield 📜
A bond turns a loan into a security that can be traded. Government-issued securities are public debt. The issuer receives money and promises contractual payments. Maturity is the scheduled principal repayment date; principal is the amount promised back. Treasury bills generally have shorter maturities than longer-term government bonds. Different countries use their own instrument names.
The coupon is a bond’s contractual periodic interest payment, if it has one; some securities pay no intermediate coupon. Yield is the return implied by the purchase price and expected payments. They aren’t synonyms: a fixed-coupon bond can offer different yields as its market price changes. Yield to maturity summarizes the cash flows under assumptions, including payment as promised. Achieving the equivalent compounded return also requires reinvesting coupons at the relevant yield.
An invented example avoids the algebra. A zero-coupon security repays €100 in one year. Buy it for €95 and earn €5 on €95 invested, provided the issuer pays. Buy it for €98 and earn €2 on €98. Higher price, lower yield—and vice versa. Not an analyst’s opinion: a relationship between what you pay and receive. Sell before maturity and your realized return also depends on the sale price.
Drawing the curve: A snapshot across maturities 📈
The yield curve, or term structure of interest rates, plots yields on comparable debt against maturity at one date. Put maturities—say three months, two years and ten years—on the horizontal axis and annual yields on the vertical. Join the points and you have the picture.
It is not one bond’s price history over ten years. It is today’s snapshot across different maturities. The horizontal axis isn’t a calendar of past quotations. Nor is there one global curve: currencies, issuers and instruments have different curves. Mixing credit qualities can confuse default risk with the effect of maturity.
Start with government debt of the same country and currency. US Treasury securities provide the familiar American example. In Germany, Bund generally refers to federal bonds, especially the longer-dated benchmark. Spain issues its own government debt. Comparable securities reduce differences without eliminating every influence: liquidity, contractual terms and taxes can matter too.
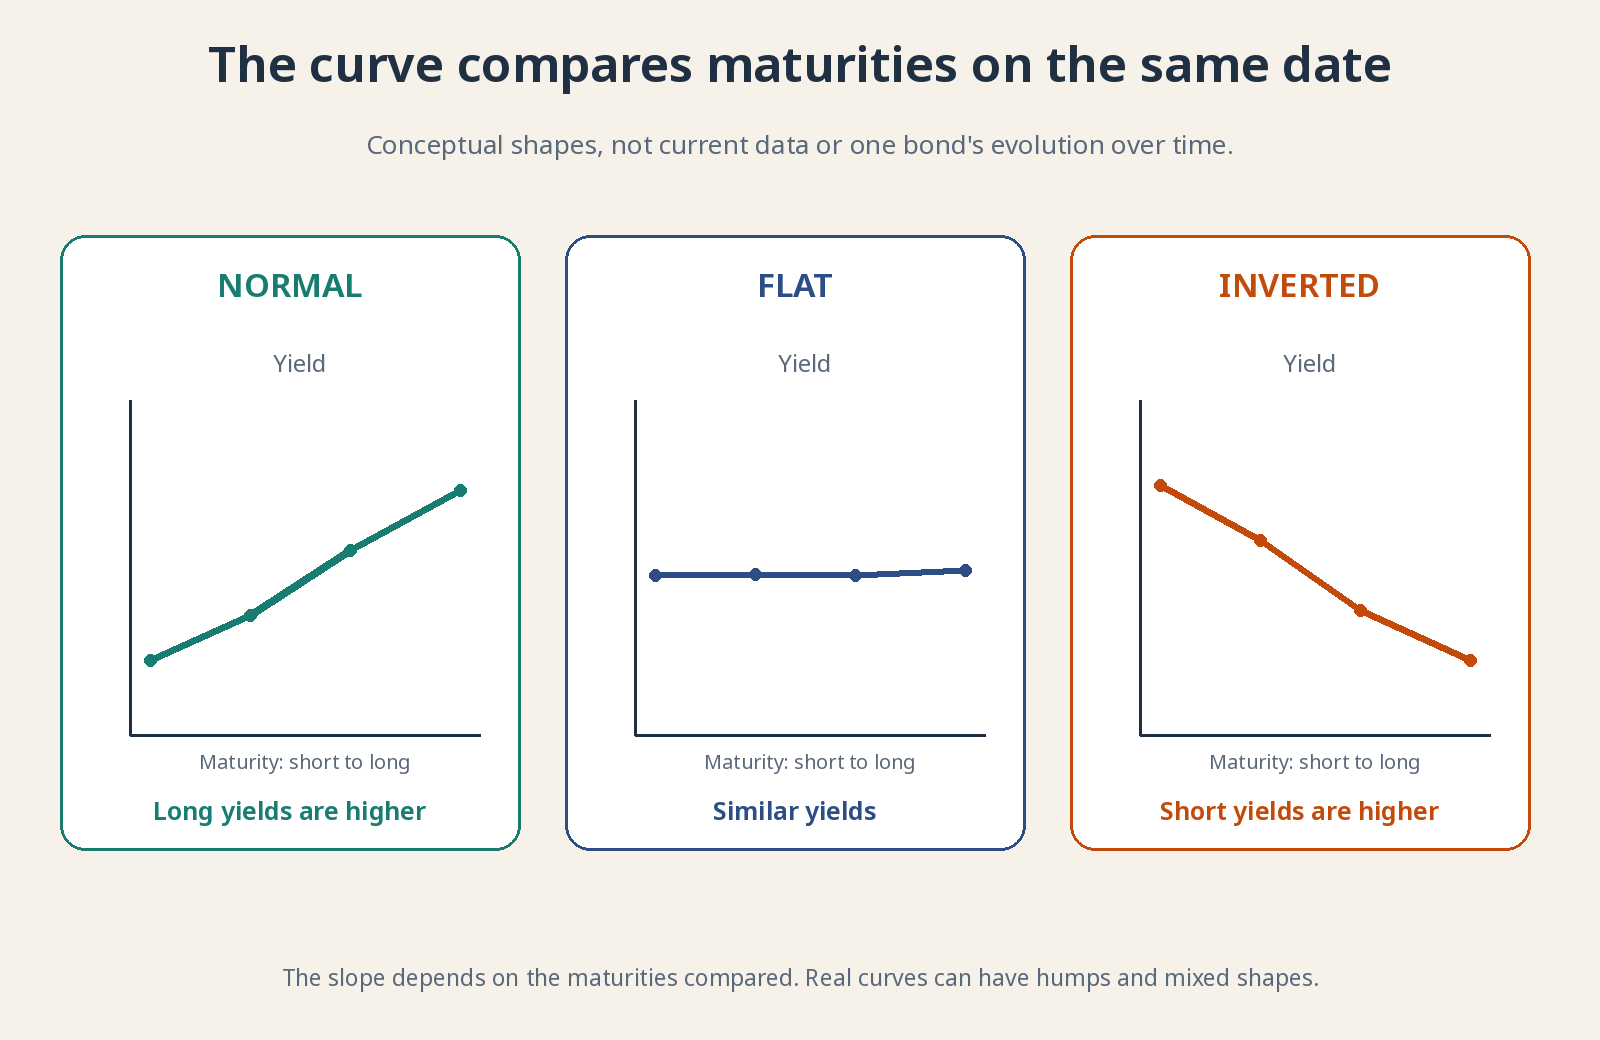
Conceptual annual yield vs. maturity. No current rate levels and no recommendation to trade.
Normal, flat and inverted: Three ways to tell a story 🛣️
A normal, upward-sloping curve generally offers higher yields at longer maturities. This can reflect expectations of higher future short rates and compensation for longer exposure to uncertainty. “Normal” is a conventional label, not a certificate of economic health. A steep curve can also reflect inflation or debt concerns.
A flat curve offers similar yields across the maturities being compared. It can appear during transitions: short rates have risen without long rates following, or investors are uncertain about the outlook. Perfect equality at every point isn’t required. Real curves can have humps and sections with different slopes.
An inverted curve has short yields above longer yields over the specified segment. That last qualification matters. Ten-year minus two-year yields can be negative while another spread remains positive. Saying “the curve is inverted” without identifying the maturities leaves half the job undone.
The difference between two yields is a yield spread. Ten-year yield minus three-month yield is negative when that segment is inverted. Spreads are often quoted in basis points: 100 basis points equal one percentage point. They do not describe a percentage fall in a bond’s price.
Who moves the short end—and who moves the long end? 🧭
The short end is strongly influenced by central-bank policy rates and expectations for the next few months. If holding money overnight earns an attractive rate, three-month lending must compete. Even so, the central bank doesn’t directly set every market yield on the screen.
A longer yield can be approximated as expected short rates over the bond’s life plus a term premium. That premium compensates for risks of holding a long instrument instead of repeatedly rolling over short ones. It isn’t a visible fee or a stable amount published with absolute precision. Models and surveys are used to estimate it.
Suppose short rates are high today but investors expect future cuts as inflation eases and activity weakens. A ten-year bond includes many years after those cuts. Its yield needn’t stay at today’s short rate for the entire decade. We’re comparing a very near-term rate with a much longer expected path—not ten years at today’s high rate against three months at the same rate.
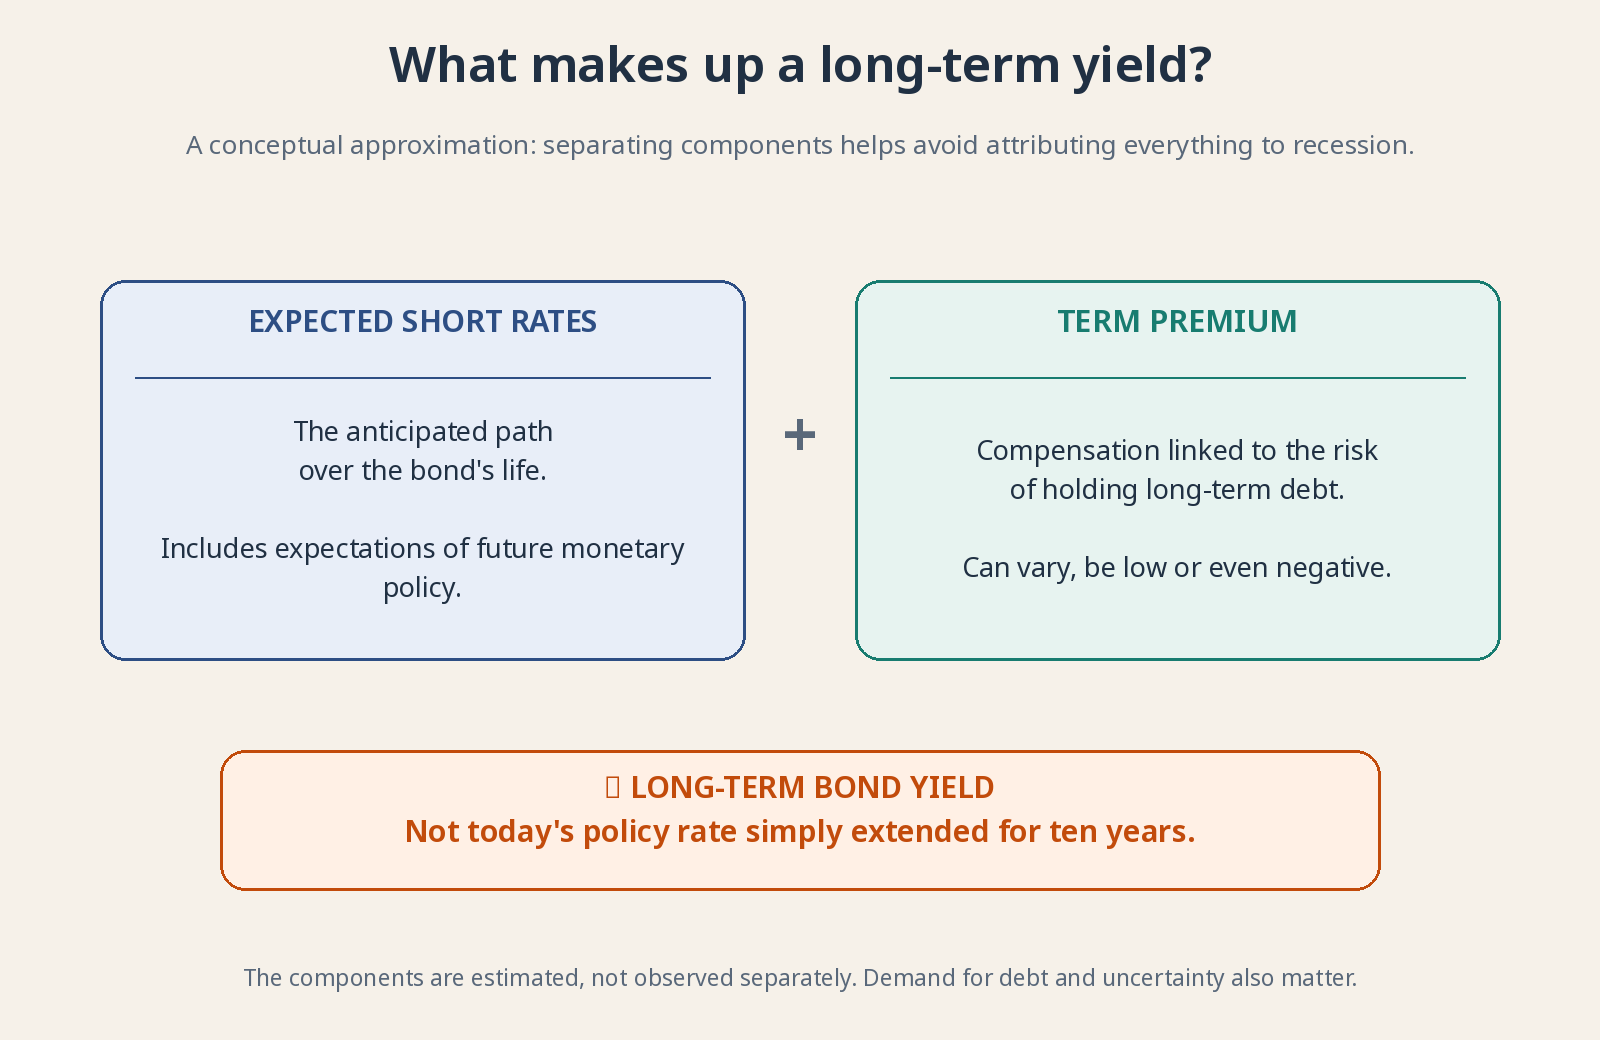
The same observed yield can reflect different combinations of expectations and risk premiums.
Why inversion has warned of recessions 🚨
There is economic logic behind the historical recession association. A central bank may keep short rates high to restrain inflation, making credit more expensive and cooling spending and investment. Investors expecting serious weakness may anticipate cuts and accept lower long-term yields. The curve combines today’s brake with expectations of tomorrow’s response.
Restrictive financing can also hurt debt-dependent businesses. Banks fund themselves in different ways and don’t simply lend at a long government-bond rate. Nevertheless, an inversion can complicate some lending margins and credit decisions. The curve isn’t a button single-handedly causing recession; it shares causes and transmission channels with it.
The New York Fed uses the ten-year minus three-month Treasury spread in a model estimating US recession probability twelve months ahead. Probability is an estimate under a statistical relationship—not certainty. The horizon belongs to that model, not a law requiring a recession exactly one year after every inversion.
US evidence is informative, but doesn’t establish an infallible rule for every country, period or maturity spread. Judge a signal by its definition, persistence, sample period and what information would actually have been available at the time.
What the curve cannot promise you 🔍
First limitation: false positives. A warning may not be followed by recession within the chosen horizon. A brief inversion of one segment differs from a persistent, widespread signal. Recessions can also follow shocks bond markets did not anticipate.
Second, the lag between signal and event varies. Expansion and stock-market gains can occur in between. Recognizing vulnerability doesn’t tell you the market peak’s date or level, or how long a decline would last. Turning the curve into an “exit everything” order also requires getting the re-entry right. Two riddles for the price of one.
Third, markets can be wrong and policy can change outcomes. If a warning prompts adjustments that avert contraction, it doesn’t prove there was never a risk. But every failed forecast can’t be excused as something that “would have happened” in an imaginary world. A useful indicator must be testable, not protected by unlimited excuses.
Fourth, a return to upward slope doesn’t automatically mean safety. Steepening can occur because short rates fall amid economic trouble or because long rates rise on inflation fears. Both produce a steeper curve, with different implications. Check which end moved and why.
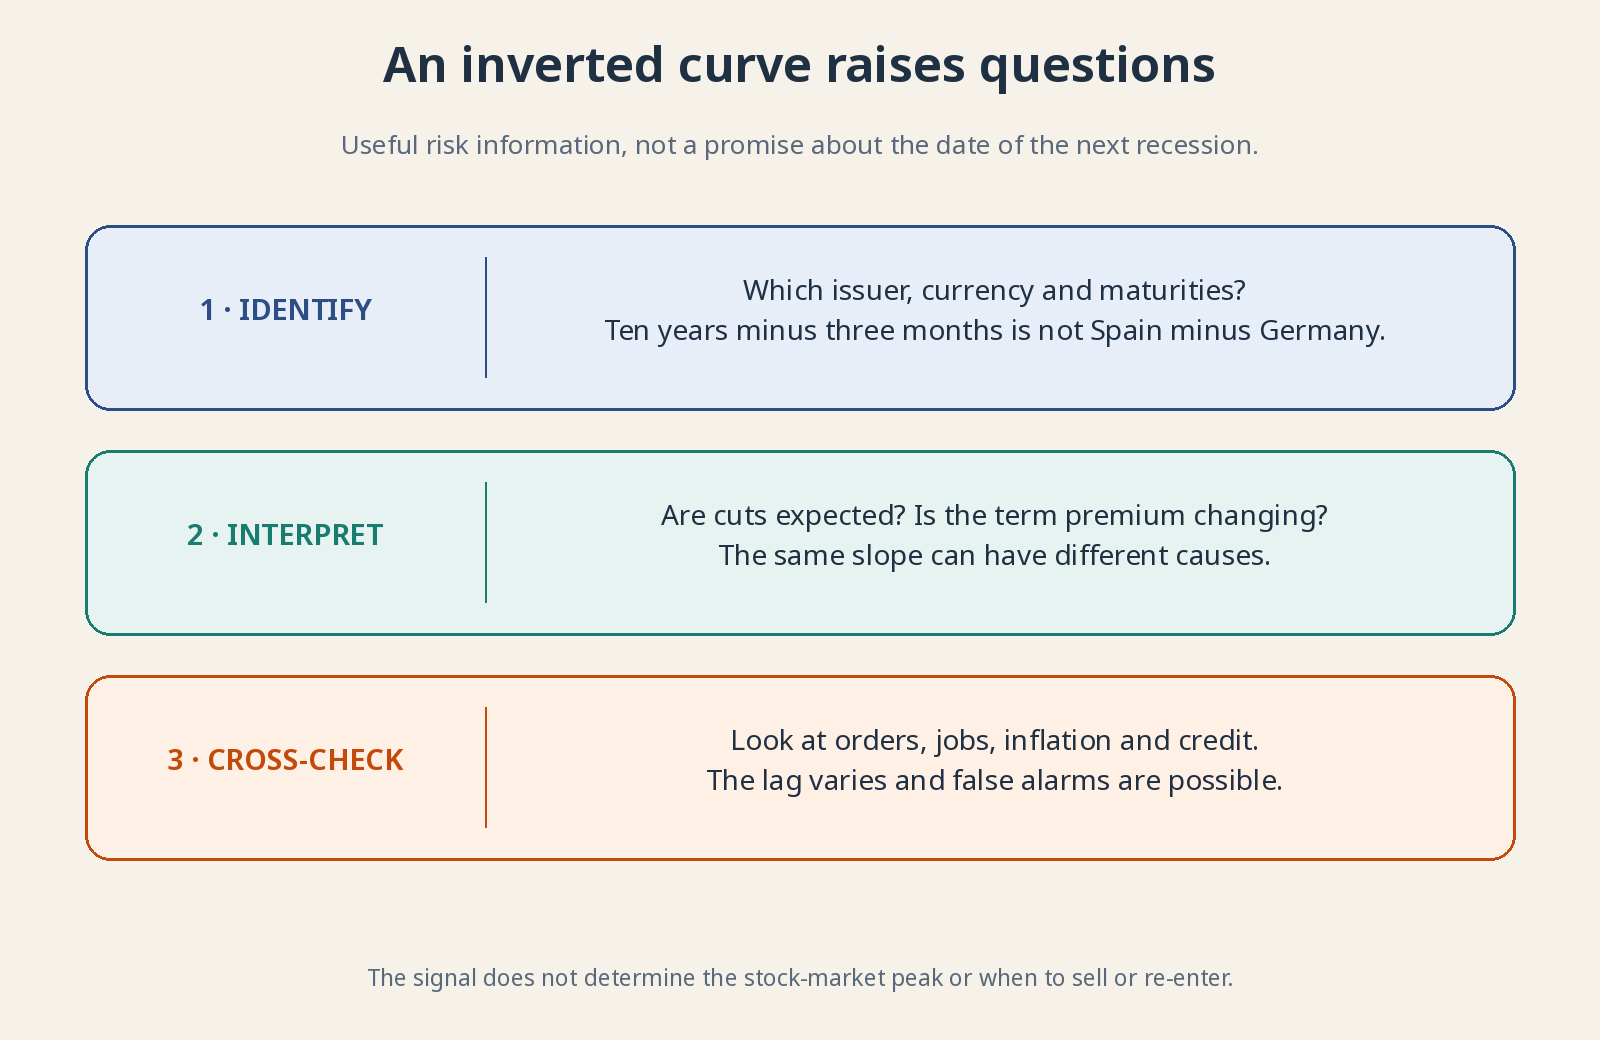
An inversion is a warning signal, not a recession appointment or an exact stock-market exit date.
Spain, Germany and the US aren’t interchangeable 🌍
Comparing Spanish and German ten-year yields measures a spread between issuers, not a maturity curve’s slope. Both use euros and share ECB monetary policy, but perceived credit risk and market liquidity can differ. Don’t confuse that gap with ten-year minus two-year yields for the same issuer.
Comparing with the US adds another currency and central bank. A higher dollar yield isn’t automatically a better euro return: exchange-rate conversion can help or hurt, and hedging costs money. No current yield levels are needed here. The mechanism shouldn’t depend on a number that may have changed by tomorrow.
Why does this matter to you as an investor? 📈
Because the curve helps explain financing, valuations and activity expectations. A company with debt maturing soon can feel high short-term rates even while markets dream about distant cuts. A long-dated bond can change price sharply when required yields move. “Government debt” doesn’t mean an unmoving price or no risk.
Use the curve alongside orders, jobs, inflation and credit. Could your investments withstand weaker growth and more expensive refinancing? Regular long-term investing doesn’t require treating each decimal point as a trade signal. The curve opens sensible questions. It doesn’t close the future by assigning it a date.
For further reading: New York Fed recession model · Expectations explanation and deadline premium. All drawings are original and conceptual; they do not represent current curves.