
The Merrill Lynch investment clock
What if the economy’s clock doesn’t tell the exact time?
The Merrill Lynch investment clock: Four environments for understanding assets, not a portfolio GPS.
Let’s be honest: four boxes, four assets and a circular arrow are irresistible. Finally, somebody seems to have organized the economy. Growth does this, inflation does that, and we know where to put the money. Then reality skips a box, doubles back and leaves the clock pointing somewhere unhelpful.
Today I want to discuss the investment clock, popularized by Merrill Lynch. It is a teaching framework for asset allocation: how a portfolio is divided among broad investment categories. Its value lies in connecting economic mechanisms. Its danger lies in mistaking a historical relationship for a railway timetable.
Where the clock comes from—and what it organizes 🕰️
Merrill Lynch, a financial institution involved in investment banking and wealth management, presented this framework in its 2004 report The Investment Clock. It examined historical US relationships among economic conditions, assets and sectors. The clock organizes evidence into a memorable picture; it was not issued with a warranty covering future market returns.
The framework combines growth and inflation. Growth describes changes in activity; inflation describes increases in the general price level. Their directions create four environments, commonly called reflation, recovery, overheating and stagflation. Think of them as conditions affecting businesses and assets, not appointments the economy has agreed to keep. Popular versions sometimes relabel phases or swap the axes; read the quadrant definitions rather than memorizing their position on the page.
The original analysis considers growth relative to trend and the direction of inflation. A merely “high” or “low” GDP figure is not enough. Output-gap estimates compare actual production with potential production, itself an uncertain estimate. Recognizing spare capacity or excessive pressure in real time is harder than labeling a finished historical chart.
Our teaching version uses improving or weakening activity momentum and rising or falling inflation. The growth arrows describe cyclical direction; they do not require a particular GDP growth sign. Falling inflation usually means disinflation, not necessarily falling prices. Deflation is a different condition. Keep direction, level and terminology separate.
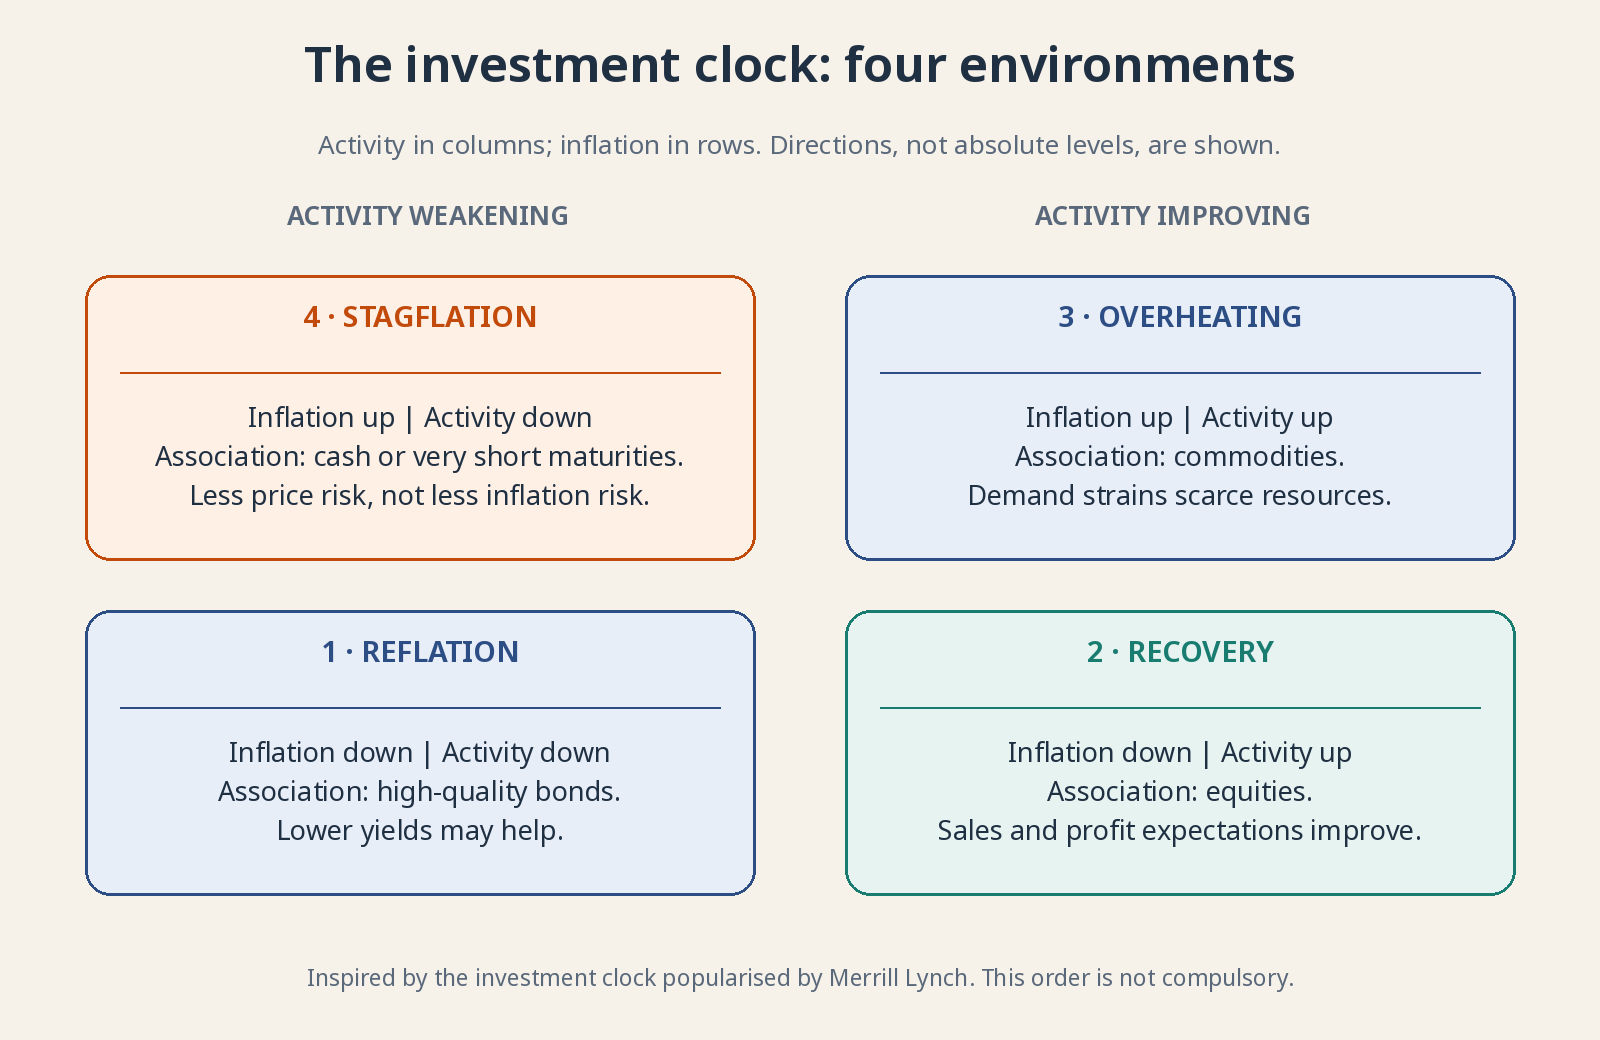
Original diagram inspired by the investment clock popularized by Merrill Lynch. Conceptual associations, not real-time classifications, guaranteed returns or portfolio allocations.
Weak activity, falling inflation: The traditional bond environment 🌧️
In the reflation quadrant, activity is weak or weakening and inflation is easing, encouraging attempts to revive demand. The label can mislead: it does not mean prices are already accelerating sharply. It describes conditions in which policy may seek to reinvigorate an economy losing momentum.
The clock associates this environment with bonds, particularly high-quality debt sensitive to interest rates. A bond is a tradable loan promising specified payments. If inflation and expected rates decline, existing fixed payments can become more attractive and bond prices rise. Credit quality and interest-rate sensitivity still determine how much protection you actually get.
Not every bond is a refuge. High-yield bonds offer higher yields because borrowers carry greater credit risk, among other factors. Weak activity can increase defaults and credit spreads, offsetting benefits from lower benchmark rates. “Bonds do well” is too broad if the borrower’s repayment prospects are deteriorating.
Within equities, defensive businesses with steadier revenue may be relatively resilient. Debt and valuation still matter. A regulated utility can have stable demand alongside heavy financing needs. Owning that company’s shares is not equivalent to owning a short-dated government security. Stable sales do not remove every other source of risk.
Improving activity, falling inflation: The traditional stock environment 🌱
In the recovery quadrant, activity improves while inflation eases. Firms may sell more as some cost pressures moderate. If financing conditions are also supportive, investment becomes more attractive. This is a potentially favorable combination, not a promise that every company’s sales, margins and balance sheet improve together.
The clock therefore associates this quadrant with equities: ownership claims whose returns are not fixed contractual payments. Cyclical businesses such as machinery makers and sellers of postponable consumer purchases can benefit strongly. Their earnings respond to improved demand. That sensitivity helps explain the association, but does not tell you the right price to pay.
Not every cost falls, and extra sales do not become profit automatically. Competition can force discounts. If shares already price in a spectacular recovery, merely good results may disappoint. The clock describes an environment; your return also depends on the expectations and valuation already embedded in the purchase price.
Nor does recovery translate into “buy technology.” A hardware maker, subscription-software business and unprofitable start-up have different financing needs and sensitivities. A sector label cannot erase valuation, cash burn or debt. Examine the actual business before assigning it the cheerful green corner of a diagram.
Strong activity, rising inflation: Commodities in the spotlight 🔥
Overheating describes activity pressing against available capacity. Certain materials, workers or transport become scarce and prices accelerate. Not all growth creates identical inflation pressure, but demand stretching supply can increase bargaining power for scarce inputs. The economy can be busy and uncomfortable at the same time.
The clock associates this setting with commodities, basic resources such as oil, copper and wheat. Supply often cannot respond quickly: opening a mine takes time, and ordering a larger harvest does not instantly produce one. Stronger demand against constrained supply can lift prices. That is the mechanism, not an assurance that prices only move upward.
A commodity is not the same asset as a producer’s shares. The company also faces wages, taxes, investment decisions, debt and political risks. Futures—contracts for delivery or settlement at a later date—bring their own mechanics and risks. Exposure through a financial product is not equivalent to holding a warehouse full of the raw material. Futures returns can differ from the change in the immediate commodity price. Explaining this quadrant is not a recommendation to trade those instruments.
Central banks may raise rates to cool inflation, while expensive energy squeezes household spending. Conditions temporarily helping a producer can therefore contribute to a later demand slowdown. Arriving in the overheating quadrant does not tell you how long favorable prices last or when the market begins anticipating the next phase.
Weakening activity, rising inflation: The awkward quadrant 🧊
Stagflation combines weak or stagnant activity with high or rising inflation. Treating one problem can aggravate the other. Higher rates restrain spending but do not manufacture gas or reopen a port; lower rates can risk persistent inflation. The uncomfortable corner is uncomfortable for a reason, not because policymakers forgot where the controls are.
Here the clock often favors cash or very short-term, high-quality money-market instruments in relative terms. The idea is to limit price sensitivity while longer-duration assets face inflation or rate pressure. This is a comparison of risks and historical tendencies, not an instruction to liquidate a long-term portfolio whenever one data point looks stagflationary. Short maturities also allow returns to reset sooner as instruments mature and are reinvested, though that does not make them identical to banknotes.
Relative resilience does not guarantee purchasing-power preservation. If inflation exceeds your return after costs and taxes, you lose real spending power despite a stable nominal balance. Deposits, Treasury bills and money-market funds also have different guarantees, pricing and liquidity features. “Cash-like” is not a complete description of their risks.
Businesses able to pass higher costs through without losing too many customers may withstand this setting better. That is pricing power, not a privilege automatically granted to large firms. Customers’ budgets and alternatives matter. Test the evidence in volumes, margins and cash generation rather than accepting the phrase in a management presentation.
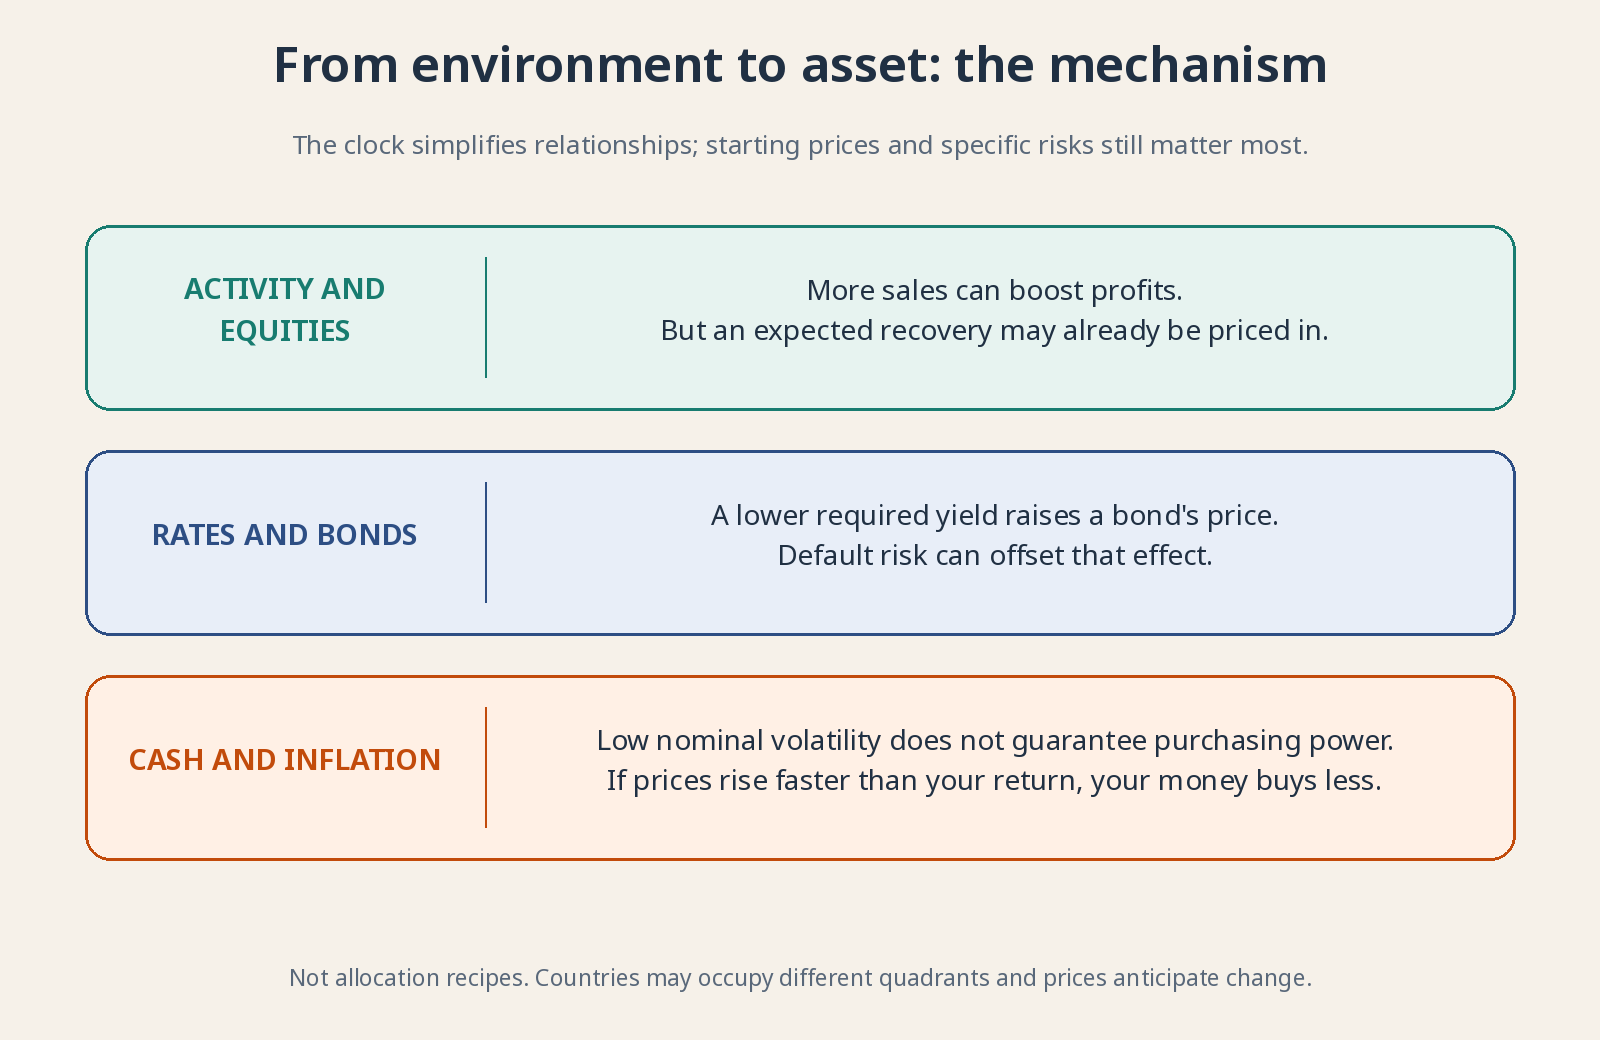
Associations describe mechanisms. They do not guarantee which asset will outperform.
Why the clock can tell the wrong time ⚠️
First, separating trend from noise in real time is difficult. A weak month can reverse, and potential-output estimates are revised. A historical study using final data knows things the contemporary investor did not. That creates hindsight problems: the clock can look much easier to read once someone has filled in yesterday’s missing numbers.
Second, economies need not visit every quadrant or move clockwise. A supply shock can raise prices and damage activity at once. Fiscal and monetary responses can change the path. The name clock is a memory aid, not evidence that the next phase arrives predictably after the current one.
Third, countries run at different speeds and companies sell across borders. A global portfolio has no single local time. A European manufacturer may depend on Asian customers and dollar financing. Reducing that mixture to the phase of your home economy ignores much of the business exposure you actually own.
Fourth, prices anticipate. Even the right connection between environment and business may not earn a good return if it is already fully priced in. Starting valuation, currency, debt and surprises matter. Bond duration indicates sensitivity to yield changes: more duration generally means a larger price response to a rate surprise. The clock does not cancel those fundamentals.
Why does this matter to you as an investor? 📈
Because it separates two questions: what is happening to activity, and what is happening to prices? A slowdown with disinflation isn’t the same as a slowdown with soaring energy costs. That distinction helps explain why stocks and bonds can fall together, or why higher company sales can coexist with thinner margins.
Use the clock to imagine scenarios and test excessive dependence on one—not to reshuffle the portfolio every quarter. Your horizon, emergency buffer and sustainable contributions matter more than picking the right box. A useful map improves your questions. A supposedly infallible trading GPS often ends by sending you down a goat track.
For further reading: The investment clock and its origins in the Merrill Lynch report. The diagrams are original illustrations inspired by the framework; no images or historical investment returns from the report are reproduced.