
5.2 Leading, coincident and lagging indicators (PMI)
Is that indicator looking through the windshield—or the rearview mirror?
Indicators and PMI: Read the signals without treating every release as a fire alarm.
A restaurant can look packed just before its owner decides not to renew two waiters’ contracts. It can also look half empty while next month’s bookings start to recover. Today’s snapshot, tomorrow’s intentions and yesterday’s consequences tell different stories. Economics does this constantly—usually with a person in a suit confidently explaining that this time the picture is perfectly clear.
Today I want to discuss economic indicators: data we use as clues about activity. We group them as leading, coincident or lagging according to their usual relationship with the cycle. Then we’ll unpack PMI, a name you’ll see repeatedly in reports. In everyday terms, it means asking people who see orders arrive before you see the product in the shop.
Two clocks: When it happens and when we find out 🕰️
First separate the reference period—the time a number describes—from the release date, when you get to read it. A report published today can describe last quarter. It is not a live feed from the economy. Before interpreting the signal, check which stretch of road the photograph actually shows.
Leading does not mean published before every other indicator. It means tending to turn before the activity you want to anticipate. Coincident does not mean available in real time either. GDP describes production during its reference period, but arrives later and is revised. Economic timing and publication timing are two different clocks.
These categories are patterns, not permanent identities. An indicator may warn early in one downturn and late in another. Epidemics, strikes and regulatory changes can alter the sequence. You’re assembling compatible clues, not searching for one number that never gets the future wrong. Such a number would make this course rather short.
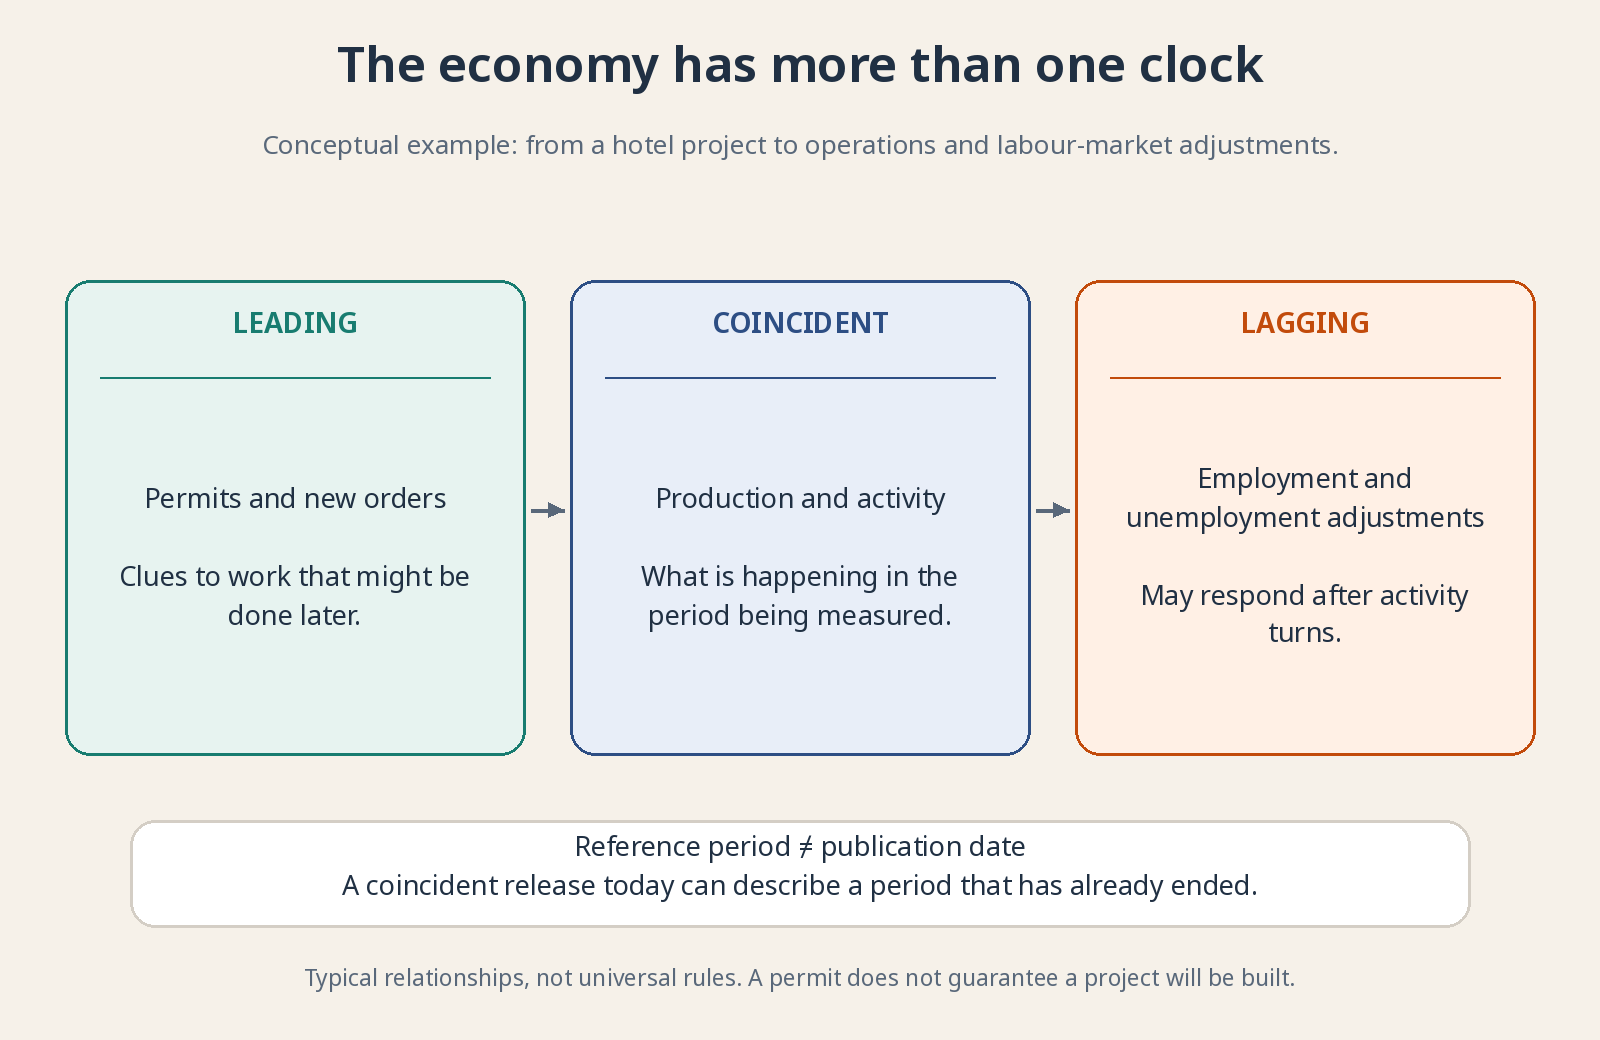
The sequence illustrates mechanisms, not fixed lead times. Each release has its own delay and revisions.
Leading indicators: Early clues, not promises 🔦
Leading indicators often turn before broader activity. Building permits, for example, usually precede hiring construction workers, ordering cement and completing buildings. But permission does not guarantee construction: financing can fail or projects can be postponed. A useful early step is still not the completed economic activity.
New orders are purchase requests or commitments received by businesses. More orders at an elevator manufacturer suggest future work even before installation begins. Check cancellations, delivery schedules and whether the figures measure value or volume. A larger order book can reflect higher prices rather than proportionally more equipment to produce. Also check whether orders are exceptional and whether fulfilling them can earn a profit. More loss-making work is not automatically good news.
Consumer-confidence surveys ask households about circumstances and expectations; bank-lending surveys describe credit conditions. Intentions and constraints help, but they are not completed purchases. You can report anxiety and still replace a broken refrigerator. Compare survey answers with behavior rather than assuming that respondents’ mood becomes next month’s spending euro for euro.
Coincident indicators: The pulse of activity 📸
Coincident indicators move broadly with current activity. GDP summarizes final goods and services produced within an economy and helps measure its size and pace. Initial estimates nevertheless arrive with a delay and incomplete information. Describing the current period economically is different from observing it perfectly while it happens.
Industrial production tracks output volume in covered industrial activities. It helps show whether factories are busier, but cannot represent an entire service-heavy economy by itself. Weak metal production does not establish that every hotel or software provider is struggling. Coverage determines how much of the wider story a measure can tell.
Sales and income add other pieces. Nominal figures use current prices; real figures adjust for price changes. A shop can report higher revenue after raising prices while selling fewer units. “Sales increased” may therefore describe more euros rather than more goods. Check the units before celebrating a stronger economy.
Lagging indicators: When the damage has left a mark 👣
Lagging indicators often react after the cycle turns. Unemployment is a familiar example: unemployed people divided by the labor force, not everyone without a job divided by the entire population. It describes an important outcome, but can continue deteriorating after some leading measures have begun improving.
Hiring and dismissing workers involve costs and organization. A company losing orders may reduce overtime before reducing staff; one recovering sales may wait before recruiting. Unemployment can consequently rise early in a recovery. The apparent contradiction often reflects a sequence of decisions rather than one statistic refusing to cooperate.
Not every employment-related series lags. Frequently published unemployment-benefit claims can warn early of deterioration. Members of the same statistical family can run at different speeds. A low unemployment rate may also hide falling participation, as lesson 3.5 explains. Check the specific measure, not just the broad employment label.
Defaults can appear late because households and businesses first use financial cushions. Don’t dismiss them for being backward-looking: realized losses affect banks, borrowers and the recovery ahead. The rear-view mirror cannot reveal the next bend, but it does show damage already sustained. Late information can still change the future path.
PMI: Ask the people placing the orders 🛒
PMI means Purchasing Managers’ Index. Purchasing managers organize supplies needed by businesses. Before furniture output increases, someone orders timber; before many services expand, someone arranges staff and inputs. Asking those people about conditions provides a timely view of business activity, though not a complete census of the economy.
Questions commonly ask whether output or activity, new orders, employment and other variables increased, stayed unchanged or decreased compared with the previous month. This is more specific than “Are you optimistic?” Many components concern reported changes already occurring. Even so, survey responses are not the same as independently measured national output totals.
The US Institute for Supply Management, ISM, publishes its own manufacturing and services indicators. It is not a central bank or government ministry. S&P Global is another provider producing PMI surveys across countries. Their samples and methods differ. Always name the provider and series rather than referring vaguely to “the PMI.”
That famous 50: Neither a growth rate nor a passing grade 🎯
Diffusion indices summarize how widespread an increase or decrease is among respondents. A basic component adds the share reporting an increase to half the share reporting no change. In a simplified example, 40% report more, 30% unchanged and 30% less: 40 + 15 = 55. Headline indices may then combine components using specified weights.
Fifty represents no net change on that diffusion scale. Above it generally signals improvement or expansion in the measured variable; below it signals deterioration or contraction. A reading of 55 is not 5% output growth or proof that 55% of the country is doing well. The distance from fifty is a survey signal, not a direct GDP growth rate.
A fall from 58 to 53 remains above fifty: expansion appears less strong, not automatically a contraction. A rise from 43 to 48 remains below fifty: contraction may be less widespread, not over. Level and direction answer different questions. And 49.9 and 50.1 are not two economic universes divided by a concrete wall.
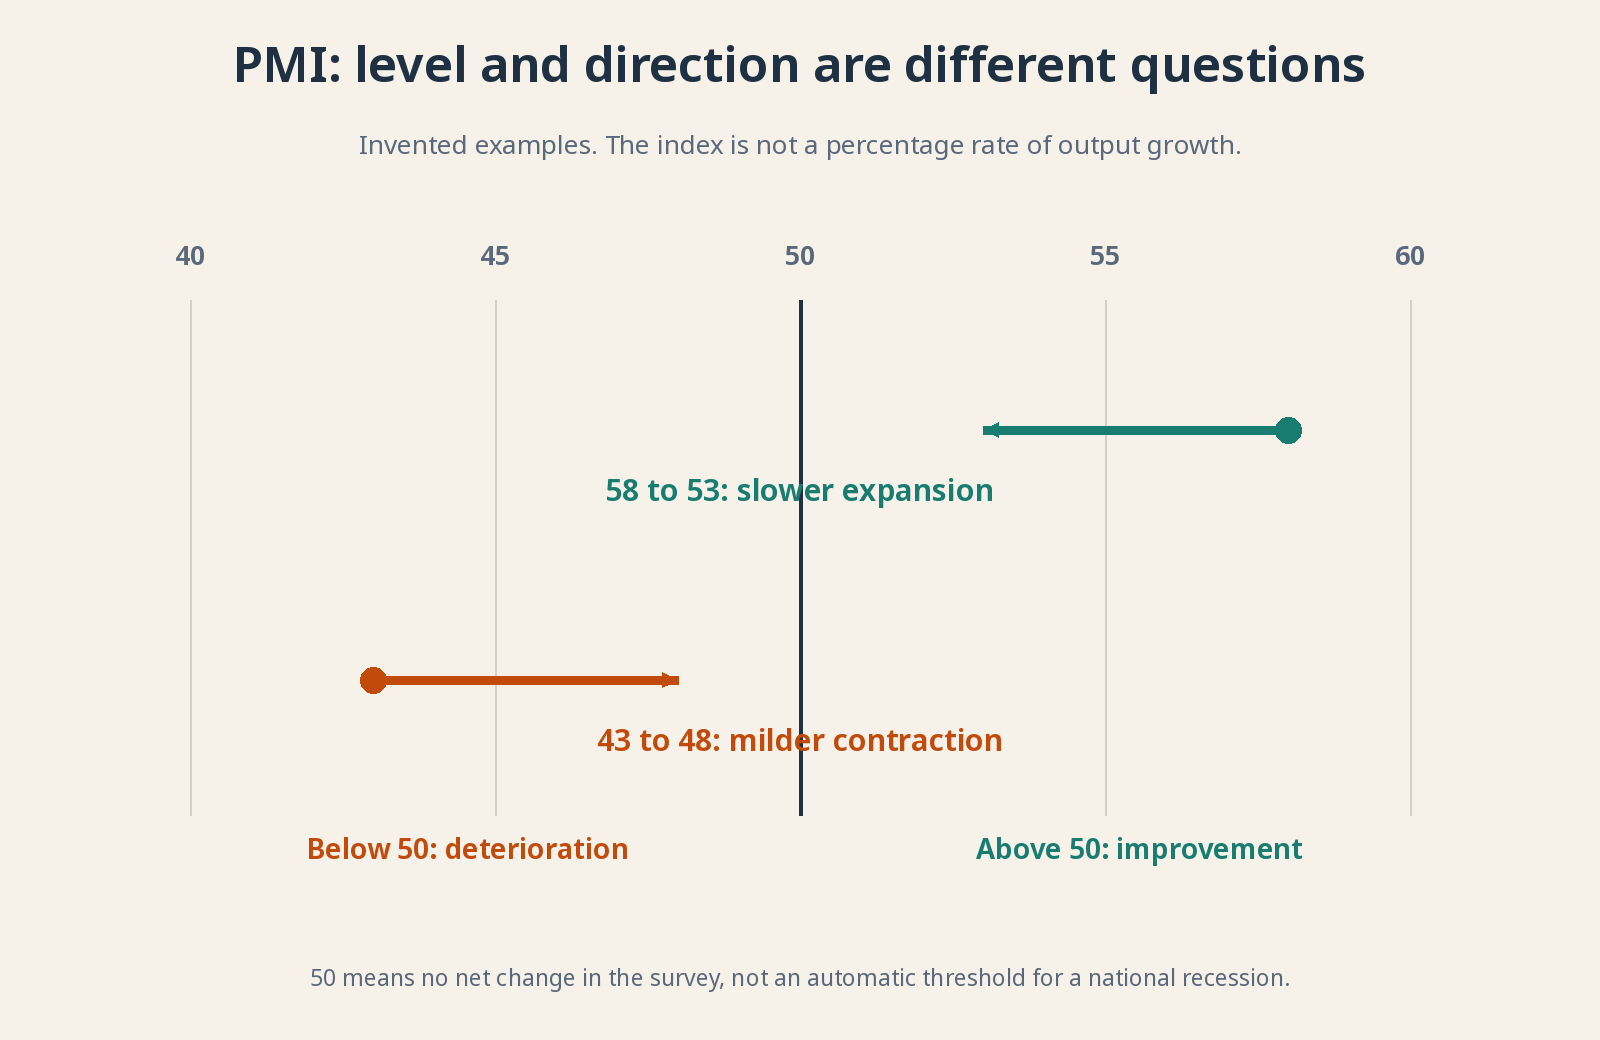
Invented readings. PMI 53 does not mean output grew 3% or 53%.
Factories and services: Don’t mix up the baskets 🧺
Manufacturing transforms materials into goods such as cars, machinery or processed food. Services cover activities such as consulting, transport and accommodation, with exact scope varying by provider. The two need not move together. A strong services reading cannot simply be substituted for a weak factory reading without considering their economic weights and coverage.
Headlines are also constructed differently. S&P Global’s manufacturing PMI combines new orders, output, employment, supplier deliveries and stocks with different weights; its services headline centers on activity. ISM uses its own combinations: five equally weighted components in manufacturing and four in services. Comparing without checking the recipe can mean comparing one exam mark with an entire course average.
For comparisons of factory output and services activity, use equivalent output or activity components where possible. Don’t assume all headline indices measure precisely the same thing. S&P Global’s composite combines manufacturing output and services activity with weights; it is not simply the arithmetic average of the two headline PMIs.
What can mislead you even when the number is right? ⚠️
Delivery times are a classic trap. In some indices, slower deliveries lift the headline because they traditionally suggested suppliers overwhelmed by demand. But a closed port can also delay shipments. The same component can then reflect supply disruption rather than healthy demand. Read the explanation before congratulating the economy on its bottleneck.
Seasonal adjustment separates recurring calendar patterns from new movements. Samples, incomplete responses and revisions add uncertainty too. Some surveys publish a preliminary flash estimate before the fuller release. Early information is valuable, but early is not synonymous with final. Compare like-for-like releases rather than mistaking changed coverage for changed economic conditions.
A sector’s fifty threshold is not a universal national recession boundary. Whole economies include activities a particular survey does not fully capture. The relationship between PMI and GDP must be estimated and can change. One weak month deserves investigation, not an automatic decision to abandon your long-term investment plan.
Why does this matter to you as an investor? 📈
Because new information changes sales and interest-rate expectations. Sometimes good data pushes stocks down: it was less good than expected, or suggests rates will stay high. The surprise—the gap between the outcome and the forecast—matters for the immediate reaction. That reaction isn’t a definitive valuation of the business.
Try a simple routine: identify country, sector, period, trend and limitations; cross-check another family of data. Then ask what it means for the customers and costs of the companies you study. You don’t need to trade the minute of release. You need to stop a headline turning your long-term portfolio into an elevator button you keep jabbing.
For further reading: ISM: how its indices are calculated · S&P Global: PMI frequently asked questions. The numbers in this lesson are teaching examples, not current readings.