Trading
Trading is a financial activity that involves buying and selling assets in the markets with the goal of making a profit. While it may seem complex, it can be understood and practiced with basic knowledge and a clear strategy. Below, we’ll explore the main indicators, and key concepts that every beginner should know.
1. Types of Trading Strategies
1.1 Escalping
This is a short-term strategy where the trader performs numerous trades per day, aiming for small profits per trade. This approach requires deep market knowledge and advanced tools.
1.2 Day trading
This strategy involves opening and closing trades within the same day. Day traders aim to take advantage of small price fluctuations within a single trading day. It requires high concentration and quick decision-making.
1.3 Swing Trading
This strategy involves holding positions for several days or weeks, taking advantage of short- to medium-term trends. It’s a suitable option for those who cannot constantly monitor the market.
1.4 Position Trading
This involves holding investments for months or years, focusing on long-term trends. It is less stressful than other styles but requires patience.
1.5 Timeframes
Traders choose timeframes (minutes, hours, days, weeks) based on their strategy. For example, scalpers prefer 1- to 5-minute periods, while swing traders opt for daily or weekly charts.
2. Key Indicators in Trading
Indicators help traders analyze the market and make informed decisions. Here are some of the most popular ones:
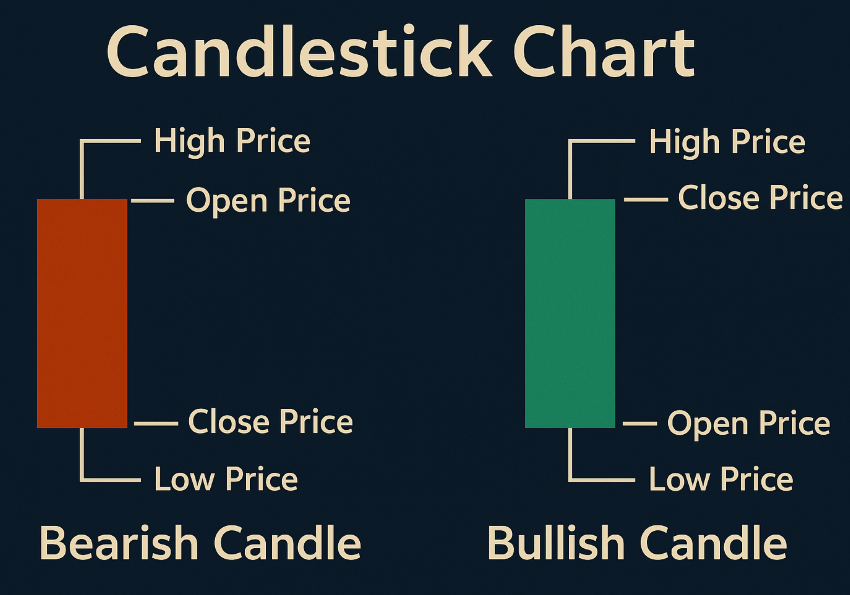
2.1 Japanese Candlesticks
Japanese candlesticks are a method of representing the price of an asset over a specific period. Each candlestick displays:
-
Open: The price at the beginning of the period.
-
Close: The price at the end of the period.
-
High: The highest price reached during the period.
-
Low: The lowest price reached during the period.
2.1.1 Types of Candlesticks
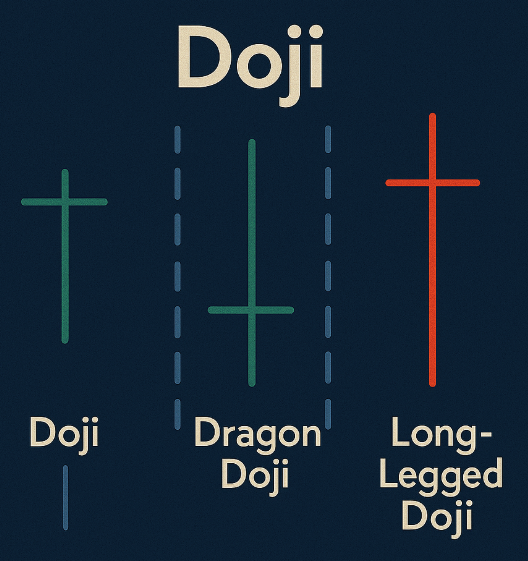
Doji:
- Very small or non-existent body.
- Indicates indecision in the market.
- Variants include: Standard Doji, Dragonfly Doji, Long-Legged Doji.
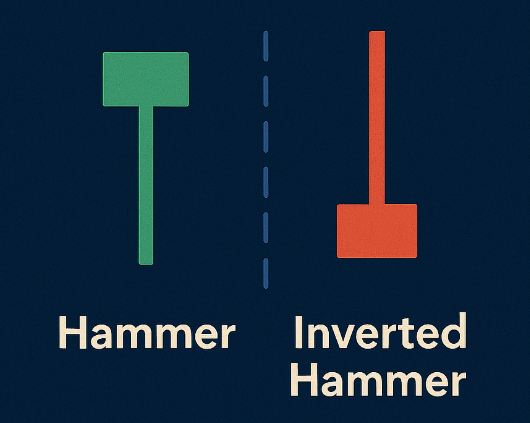
🔨 Hammer
In trading, hammer candlesticks are Japanese candlestick patterns that often signal a possible trend reversal, especially after a bearish move. There are several types, each with its own characteristics:
Hammer
-
Appearance: Small body at the top with a long lower wick.
-
Color: Can be green or red, although green is usually more bullish.
-
Meaning: A potential bullish reversal signal during a downtrend.
Inverted Hammer
-
Appearance: Small body at the bottom with a long upper wick.
-
Color: Generally green.
-
Meaning: Also suggests a bullish reversal, but with less reliability than the classic hammer.
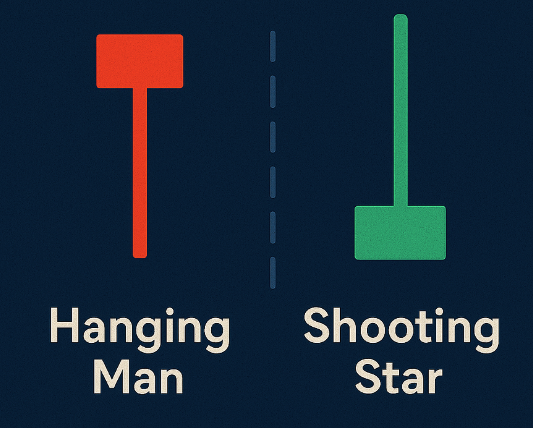
Hanging Man
-
Appearance: Same as the hammer, but appears after an uptrend.
-
Color: Usually red.
-
Meaning: Possible bearish reversal signal; indicates weakness in the upward movement.
Shooting Star
-
Appearance: Similar to the inverted hammer but appears in an uptrend.
-
Color: Generally red.
-
Meaning: Indicates a potential bearish reversal after a rise.
Although they may look visually similar, the context of the preceding trend defines whether they are interpreted as bullish or bearish signals.
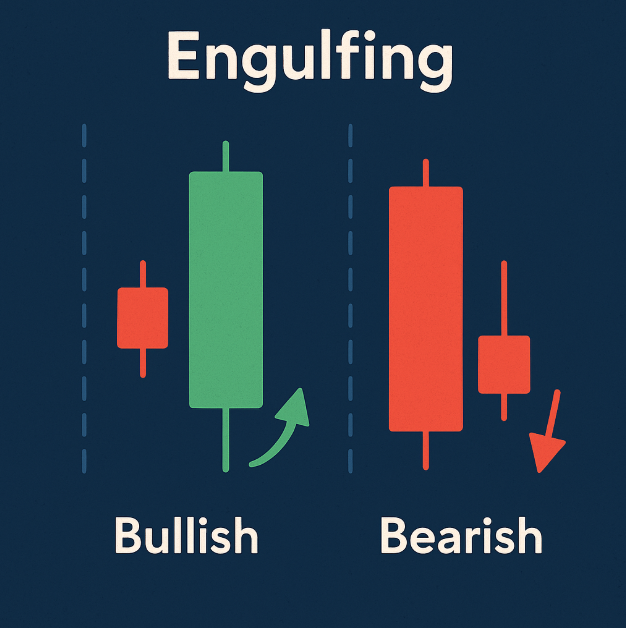
Engulfing Candles:
-
A large candle that completely engulfs the previous one.
-
Bullish Engulfing: Indicates a possible upward move.
-
Bearish Engulfing: Indicates a possible downward move.
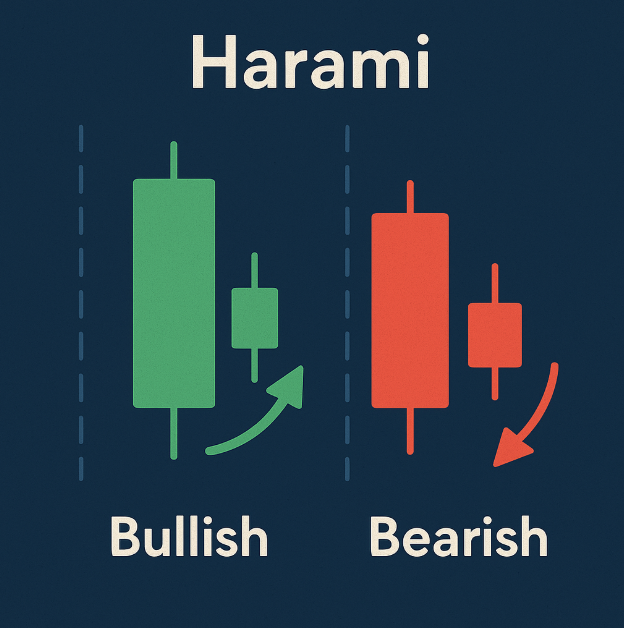
Harami:
- Small candle within the range of a larger preceding candle.
- Bullish Harami or Bearish Harami, depending on the trend.
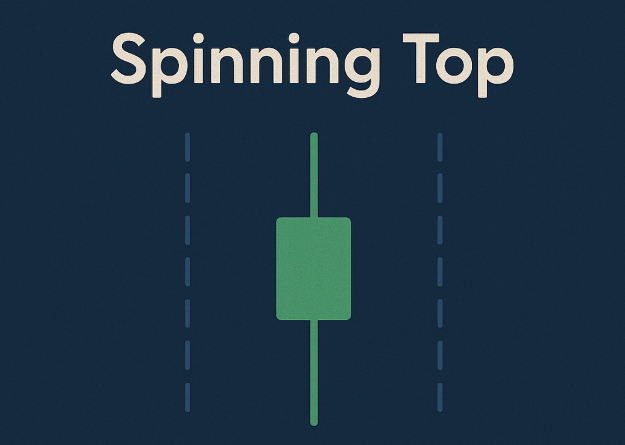
Spinning Top:
- Small body with long wicks.
- Indicates indecision or a possible trend change.
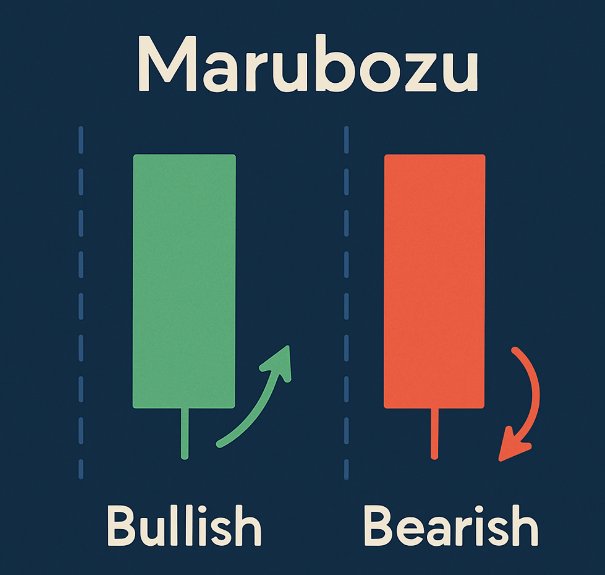
Marubozu:
- No wicks, with a large body.
- Bullish Marubozu: Strong buying pressure.
- Bearish Marubozu: Strong selling pressure.
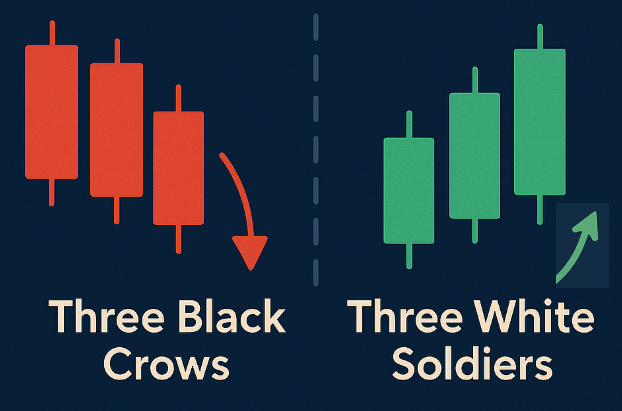
Three Black Crows / Three White Soldiers:
- Three Black Crows: Three consecutive bearish candles, signaling a strong downtrend.
- Three White Soldiers: Three consecutive bullish candles, signaling a strong uptrend.
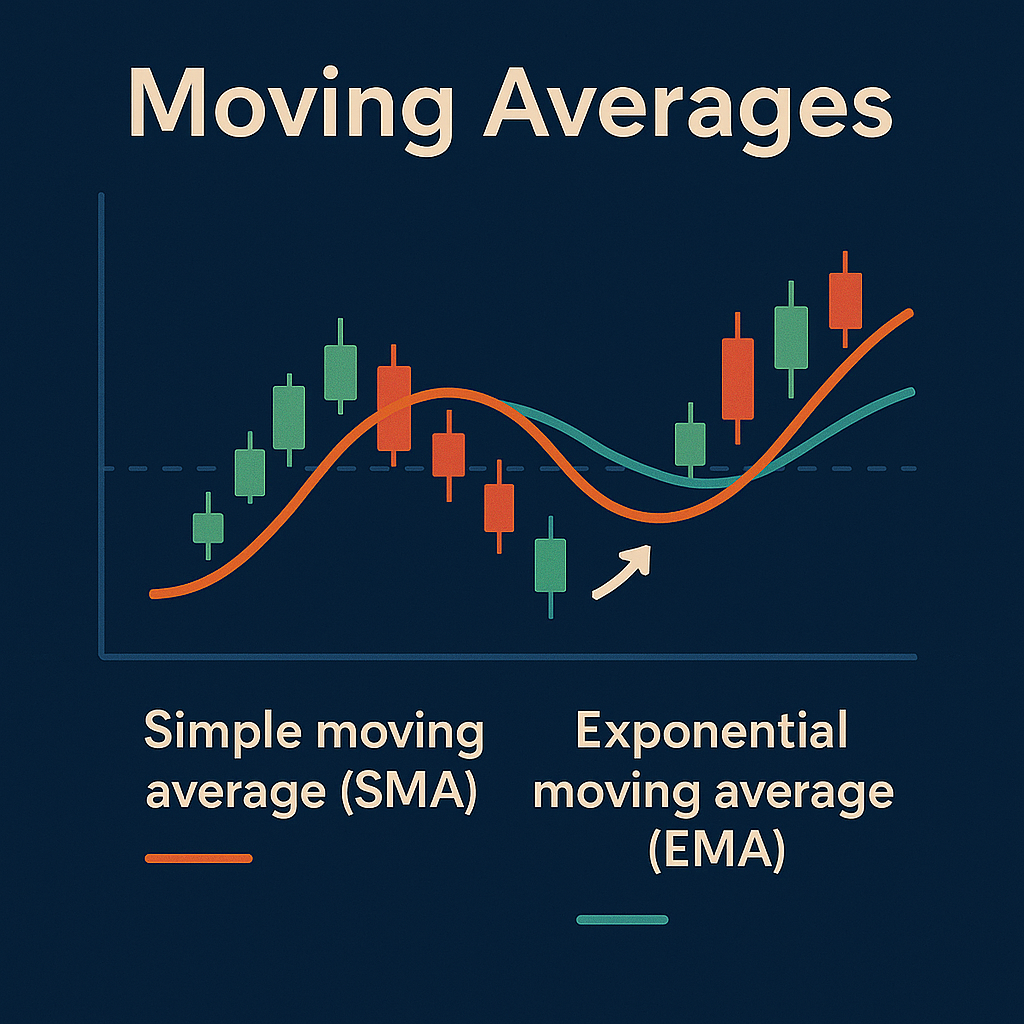
2.2 Moving Averages
Moving averages are lines that smooth out price movements and show trends:
-
Simple Moving Average (SMA): The average of closing prices over a period.
-
Exponential Moving Average (EMA): Gives more weight to recent data.
-
Moving Average Crossover: When a faster-moving average crosses a slower one, it may indicate a trend reversal.
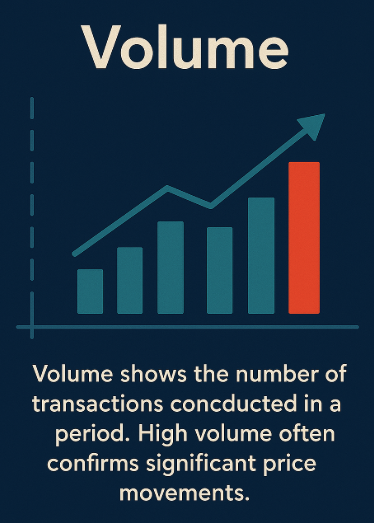
2.3 Volume
Volume shows the number of transactions made during a period. High volume usually confirms significant price movements.
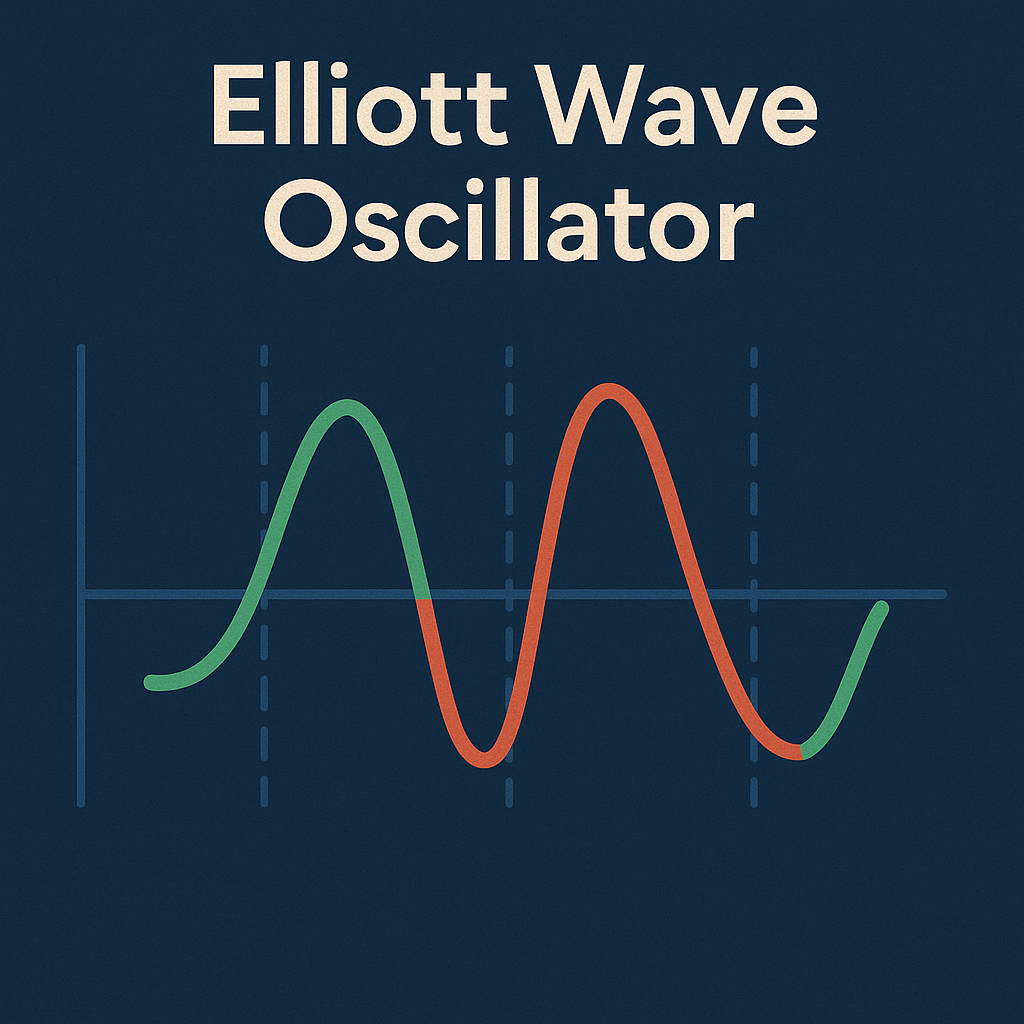
2.4 Elliott Wave Oscillator
Based on Elliott Wave theory, this indicator helps identify market patterns and potential entry or exit points.
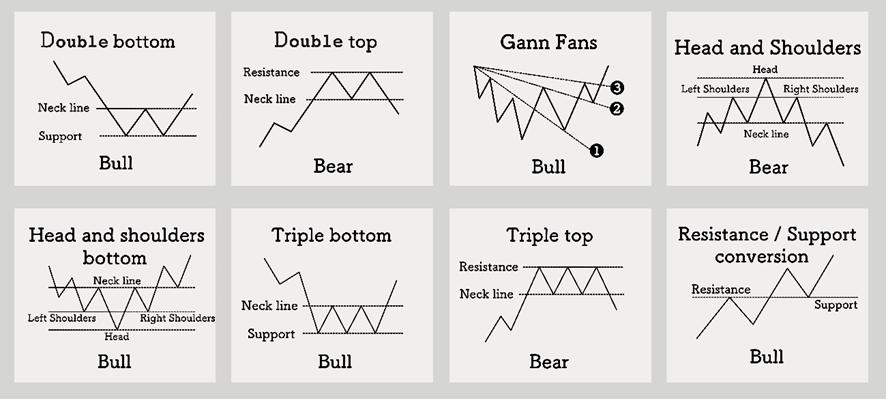
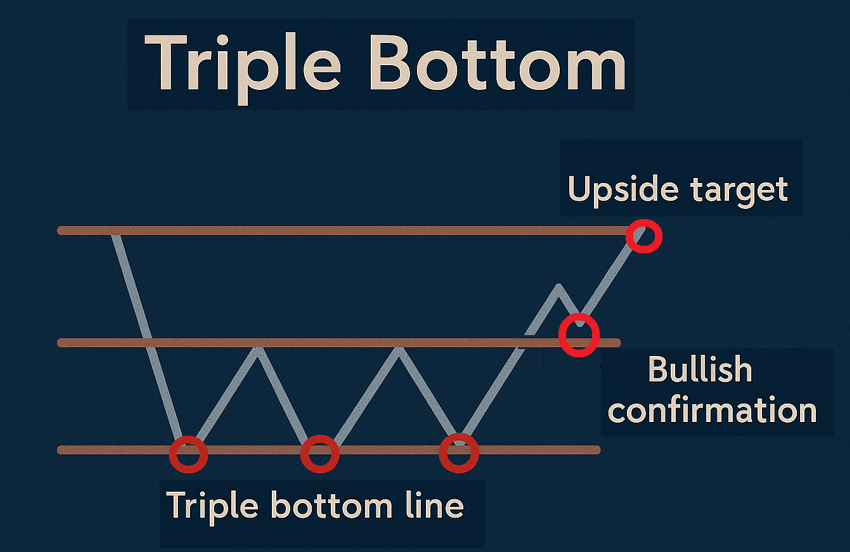
2.5 Bottoms and Double Bottoms
A bottom is a level where the price finds support and stops falling. A double bottom indicates a possible bullish reversal.
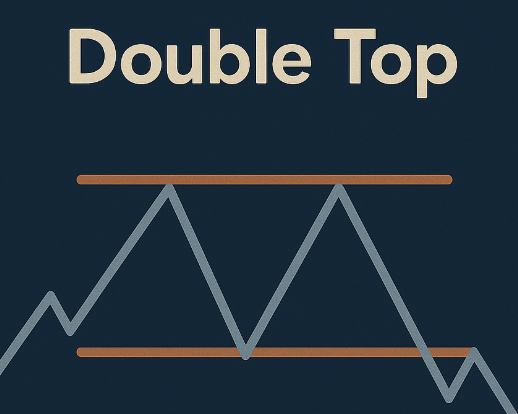
2.6 Tops and Double Tops
A top is a level where the price faces resistance and stops rising. A double top may signal a bearish reversal.
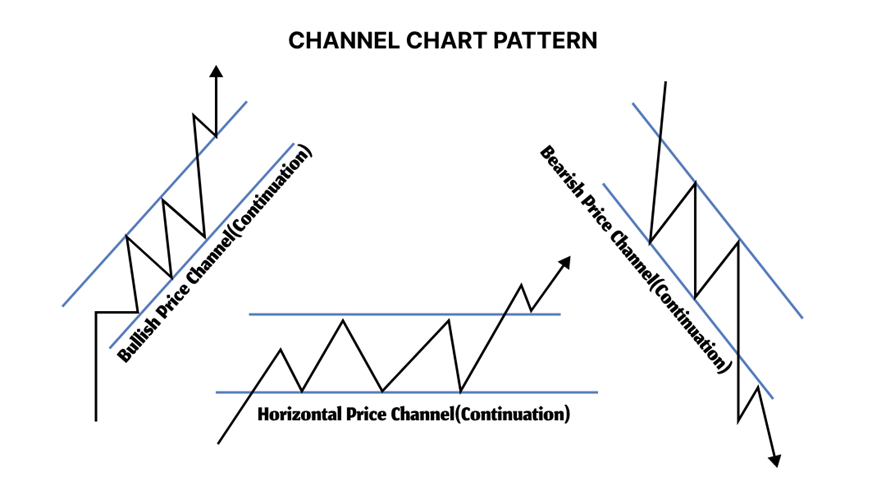
2.7 Channel
A channel is a range in which the price moves in parallel between support and resistance lines.
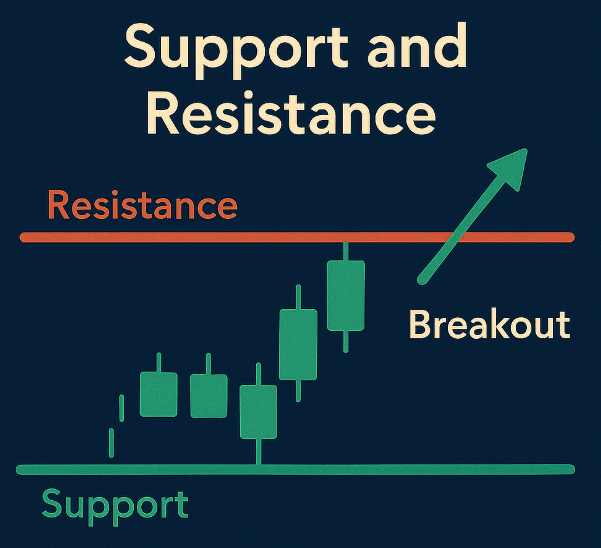
2.8 Resistance and Support Levels
- Resistance: A level where the price struggles to rise further.
- Support: A level where the price struggles to fall further.
- Breakouts: When the price breaks through a support or resistance level, it may indicate a strong move in that direction.
2.9 Common Expressions:
-
Falling Knife: A price that is dropping rapidly.
-
Blue Sky Breakout (Free Climb): A price with no nearby resistance levels.
-
ATH (All Time High): The highest price ever reached in history.
-
52-Week Low: The lowest price in the past year.
3. Success and Failure Cases
Success
A trader who studied patterns, managed risk well, and applied disciplined strategies—like Jesse Livermore in his early years—was able to achieve consistent returns by anticipating market trends and avoiding impulsive decisions.
Failure
Many beginner traders lose money by trading without a plan, overleveraging, or letting emotions drive their decisions. For example, a novice trader might invest all their capital in a stock that has surged rapidly without analyzing the fundamentals, only to see the price drop significantly due to a market correction, resulting in a substantial loss.
4. Reflection: Is Trading a Reliable Method?
Trading can be profitable, but it is not foolproof. Indicators help analyze the past but do not guarantee future movements. Discipline, risk management, and continuous education are essential to improve the odds of success.
This section only includes what I find most relevant and reliable. There are other terms like Fibonacci levels, Bollinger Bands, or patterns such as Head and Shoulders... which I don't believe in as much. If you need more information, there is plenty of material available online.
The shorter the time frame, the more unpredictable trends become. I would use at least daily-scale charts, not less, so I rule out any trading style below Swing Trading.