Indicators
1. Fear & Greed Index
The Fear & Greed Index, developed by CNN Business, is an indicator that measures market sentiment, determining whether investors are acting out of fear or greed. It is based on the premise that markets tend to behave irrationally at extremes of fear and greed, which can create investment opportunities.
1.1 Components of the Fear & Greed Index
The index is built from seven market indicators:
- Market momentum: Compares the current performance of the S&P 500 with its 125-day moving average.
- Stock price strength: The number of stocks reaching 52-week highs versus those hitting lows.
- Market breadth: The ratio of advancing to declining stocks on the New York Stock Exchange.
- Put and call options: The level of activity in put (sell) options relative to call (buy) options.
- Demand for junk bonds: The difference between the yield on high-yield bonds and safe government bonds.
- Market volatility (VIX): Measures expected market volatility.
- Safe-haven asset demand: Compares the performance of stocks and Treasury bonds.
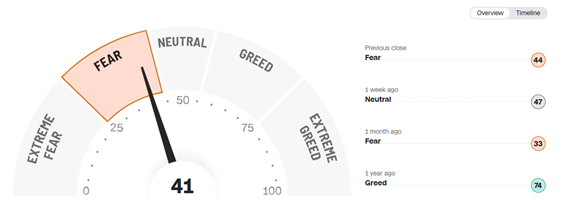
1.2 Interpretation of the Fear & Greed Index
The index moves on a scale from 0 to 100:
- 0-24: Extreme Fear – Investors are nervous, which may create buying opportunities.
- 25-49: Fear – The market still reflects risk aversion.
- 50: Neutral – A balance between buyers and sellers.
- 51-74: Greed – Investors are confident and optimistic.
- 75-100: Extreme Greed – Signals of overbuying and potential correction.
1.3 Application in Investment
This indicator is useful for detecting market extremes. At extreme fear levels, prices may be undervalued, offering buying opportunities. At extreme greed levels, it can be a warning sign to take profits and reduce exposure to overvalued assets.
https://edition.cnn.com/markets/fear-and-greed
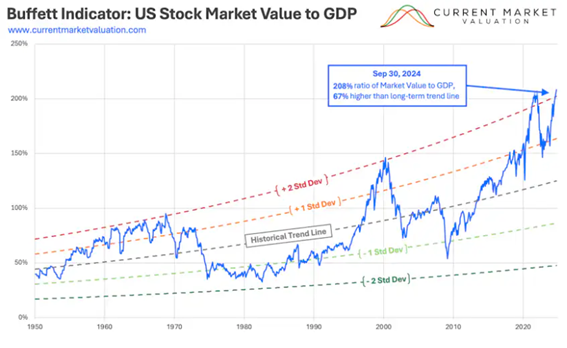
2. Buffett Indicator
The Buffett Indicator, also known as the market capitalization-to-GDP ratio, is a metric popularized by Warren Buffett to assess whether the overall market is overvalued or undervalued. It is calculated as:
2.1 Interpretation of the Buffett Indicator
- Below 75%: The market is undervalued, potentially offering buying opportunities.
- Between 75% and 100%: The market is fairly valued.
- Above 100%: The market is overvalued, indicating a risk of correction.
- Above 150%: A potential market bubble warning.
2.2 Application in Investment
This ratio helps investors make strategic decisions based on the overall market valuation. If the indicator is at high levels, a defensive strategy may be advisable, reducing exposure to equities and increasing investments in lower-risk assets.
https://currentmarketvaluation.com/models/buffett-indicator.php
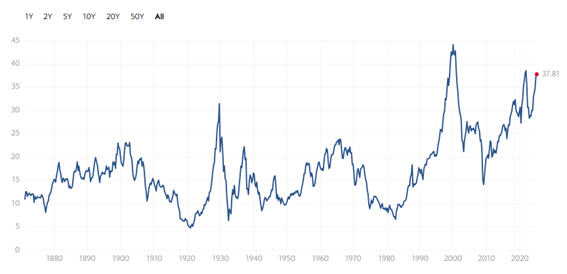
3. Shiller P/E Ratio (CAPE Ratio)
The Shiller P/E Ratio, or Cyclically Adjusted Price-to-Earnings Ratio (CAPE Ratio), developed by Robert Shiller, is a variation of the traditional price-to-earnings ratio (P/E). It is calculated by dividing stock prices by the average inflation-adjusted earnings over the past 10 years.
3.1 Interpretation of the Shiller P/E Ratio
- Low values (<15): The market is undervalued.
- Moderate values (15-25): The market is at a reasonable level.
- High values (>25): The market may be overvalued.
- Extremely high values (>30-35): A sign of a potential bubble.
Historically, when the CAPE Ratio has exceeded 30, market corrections have occurred in the following years.
3.2 Application in Investment
The Shiller P/E Ratio is useful for evaluating the market’s long-term valuation. Value investors use it to identify periods of overvaluation and adjust their asset allocation accordingly.